Weakly-Supervised Pathology Detection and Localization in 3D Chest CT
Self-supervised contrastive pretraining for semiological signs in chest CT, from few annotated patches
INSA Lyon (CREATIS) · Hospices Civils de Lyon · Philips
Abstract
Background: Recent advancements in anomaly detection have paved the way for novel radiological reading assistance tools that support the identification of findings, aimed at saving time. The clinical adoption of such applications requires a low rate of false positives while maintaining high sensitivity.
Purpose: In light of recent interest and development in multi pathology identification, we present a novel method, based on a recent contrastive self-supervised approach, for multiple chest-related abnormality identification including low lung density area ("LLDA"), consolidation ("CONS"), nodules ("NOD") and interstitial pattern ("IP"). Our approach alerts radiologists about abnormal regions within a computed tomography (CT) scan by providing 3D localization.
Methods: We introduce a new method for the classification and localization of multiple chest pathologies in 3D Chest CT scans. Our goal is to distinguish four common chest-related abnormalities: "LLDA", "CONS", "NOD", "IP" and "NORMAL". This method is based on a 3D patch-based classifier with a Resnet backbone encoder pretrained leveraging recent contrastive self supervised approach and a fine-tuned classification head. We leverage the SimCLR contrastive framework for pretraining on an unannotated dataset of randomly selected patches and we then fine-tune it on a labeled dataset. During inference, this classifier generates probability maps for each abnormality across the CT volume, which are aggregated to produce a multi-label patient-level prediction. We compare different training strategies, including random initialization, ImageNet weight initialization, frozen SimCLR pretrained weights and fine-tuned SimCLR pretrained weights. Each training strategy is evaluated on a validation set for hyperparameter selection and tested on a test set. Additionally, we explore the fine-tuned SimCLR pretrained classifier for 3D pathology localization and conduct qualitative evaluation.
Results: Validated on 111 chest scans for hyperparameter selection and subsequently tested on 251 chest scans with multi-abnormalities, our method achieves an AUROC of 0.931 (95% confidence interval [CI]: [0.9034, 0.9557], p-value < 0.001) and 0.963 (95% CI: [0.952, 0.976], p-value < 0.001) in the multi-label and binary (i.e., normal versus abnormal) settings, respectively. Notably, our method surpasses the area under the receiver operating characteristic (AUROC) threshold of 0.9 for two abnormalities: IP (0.974) and LLDA (0.952), while achieving values of 0.853 and 0.791 for NOD and CONS, respectively. Furthermore, our results highlight the superiority of incorporating contrastive pretraining within the patch classifier, outperforming Imagenet pretraining weights and non-pretrained counterparts with uninitialized weights (F1 score = 0.943, 0.792, and 0.677 respectively). Qualitatively, the method achieved a satisfactory 88.8% completeness rate in localization and maintained an 88.3% accuracy rate against false positives.
Conclusions: The proposed method integrates self-supervised learning algorithms for pretraining, utilizes a patch-based approach for 3D pathology localization and develops an aggregation method for multi-label prediction at patient-level. It shows promise in efficiently detecting and localizing multiple anomalies within a single scan.
Keywords: 3D pathology localization; computed tomography; multi‐abnormality detection; self‐supervised learning; weakly‐supervised learning.
Method
The goal is to distinguish four semiological signs present in most pulmonary pathologies, plus normal lung tissue: LLDA (low lung density area, covering emphysema and cysts), CONS (consolidation, where air is replaced by fluid or tissue), NOD (nodules and masses) and IP (interstitial pattern, including honeycombing, ground glass and reticulation).
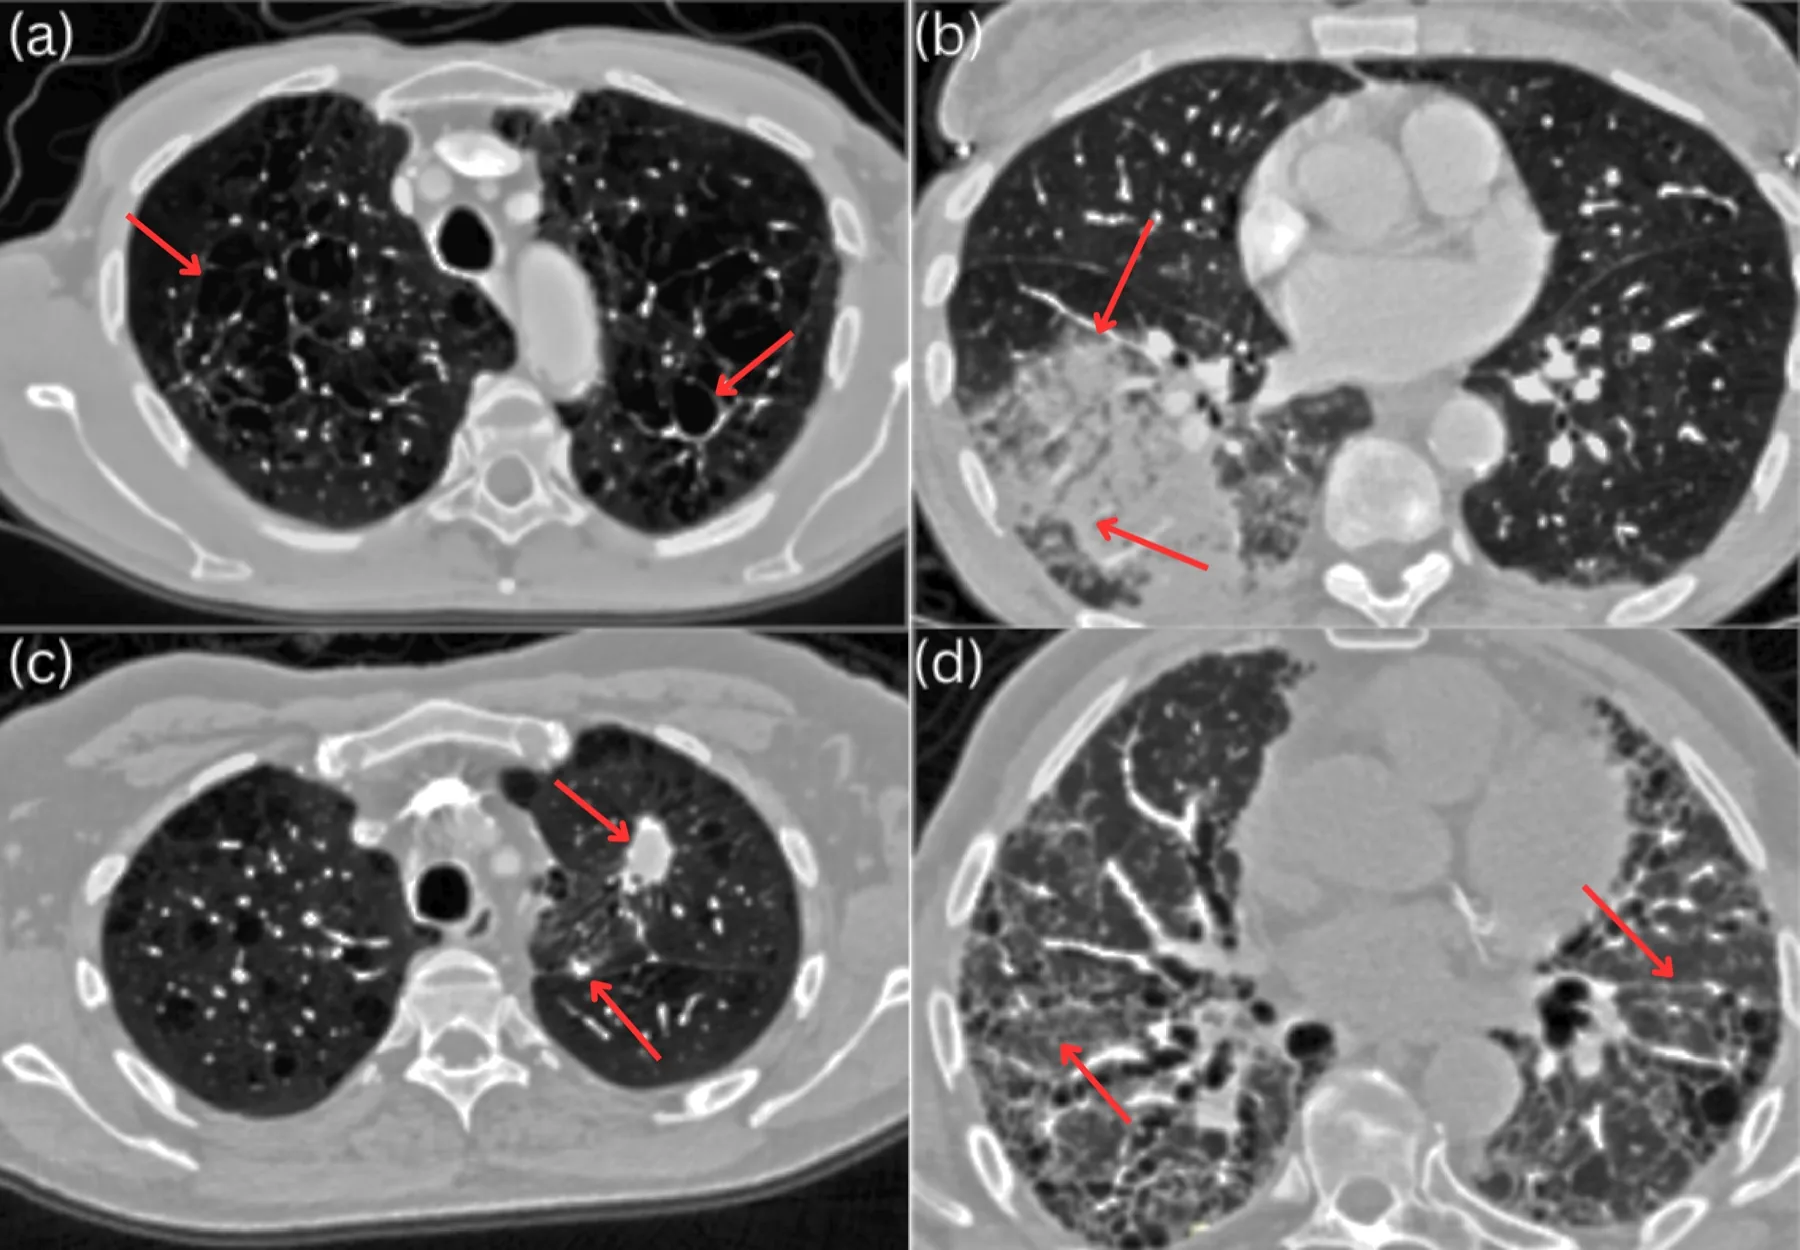
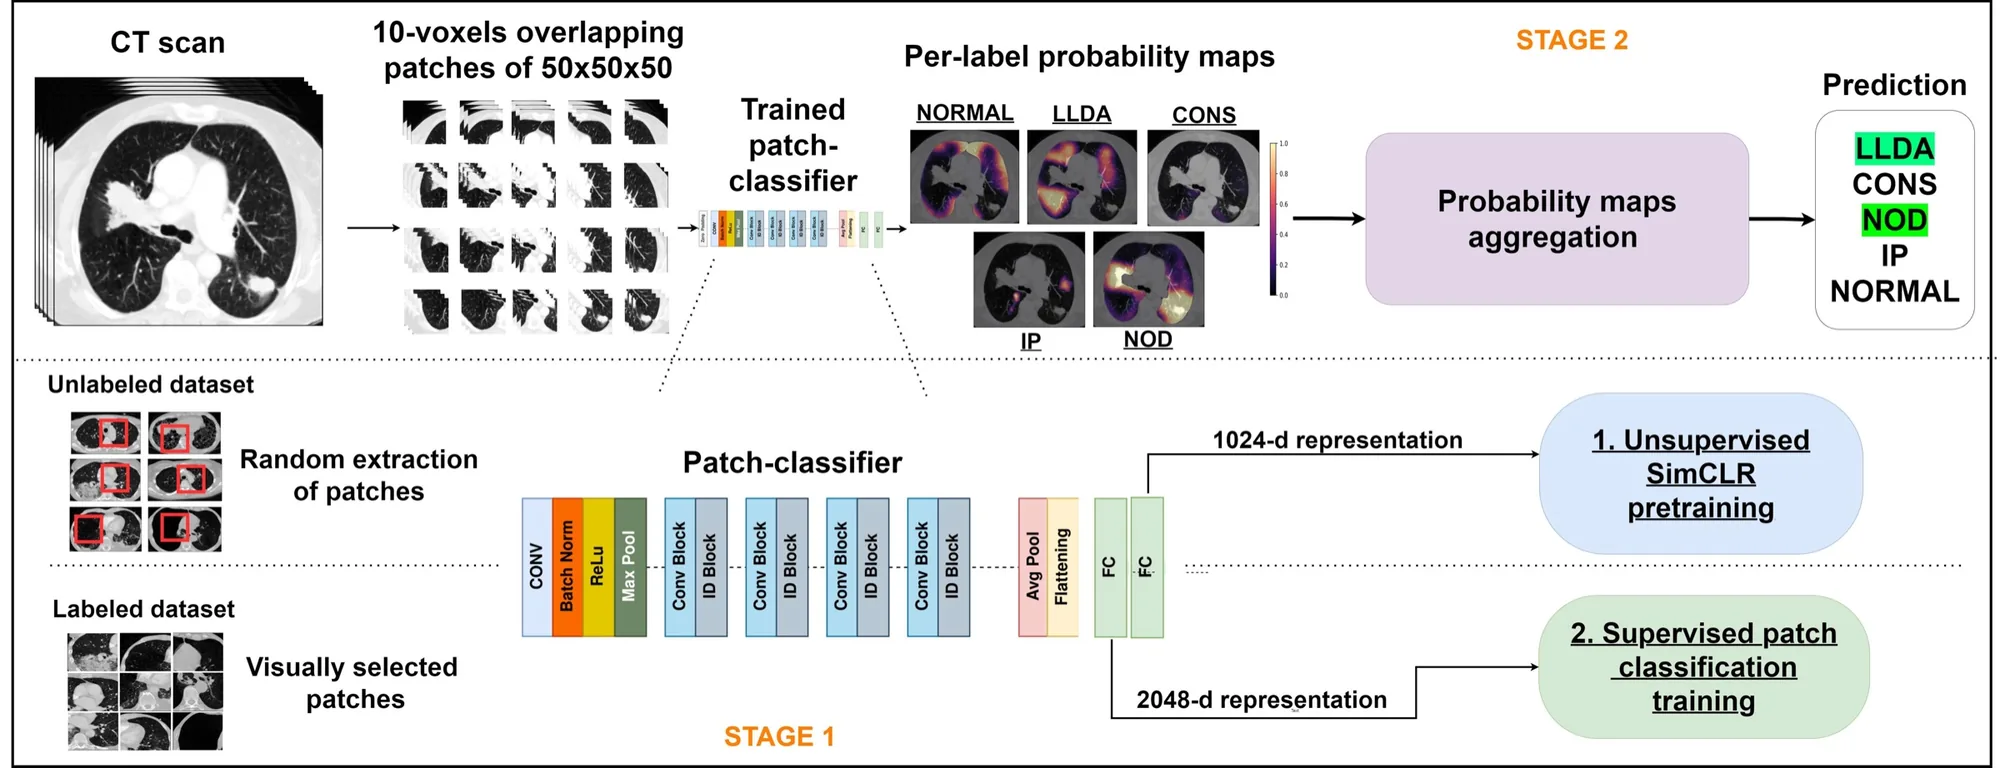
A patch-based approach is used for three reasons: lower annotation cost with localized supervision, lower memory use than full volumes, and a built-in proxy for localization. It also suits contrastive pretraining, which needs a large number of samples: patches multiply the samples available from each scan.
2.1Contrastive pretraining (SimCLR)
- Patch sampling. Random 50 × 50 × 50 patches containing at least 80% lung, using an automatic lung segmentation.
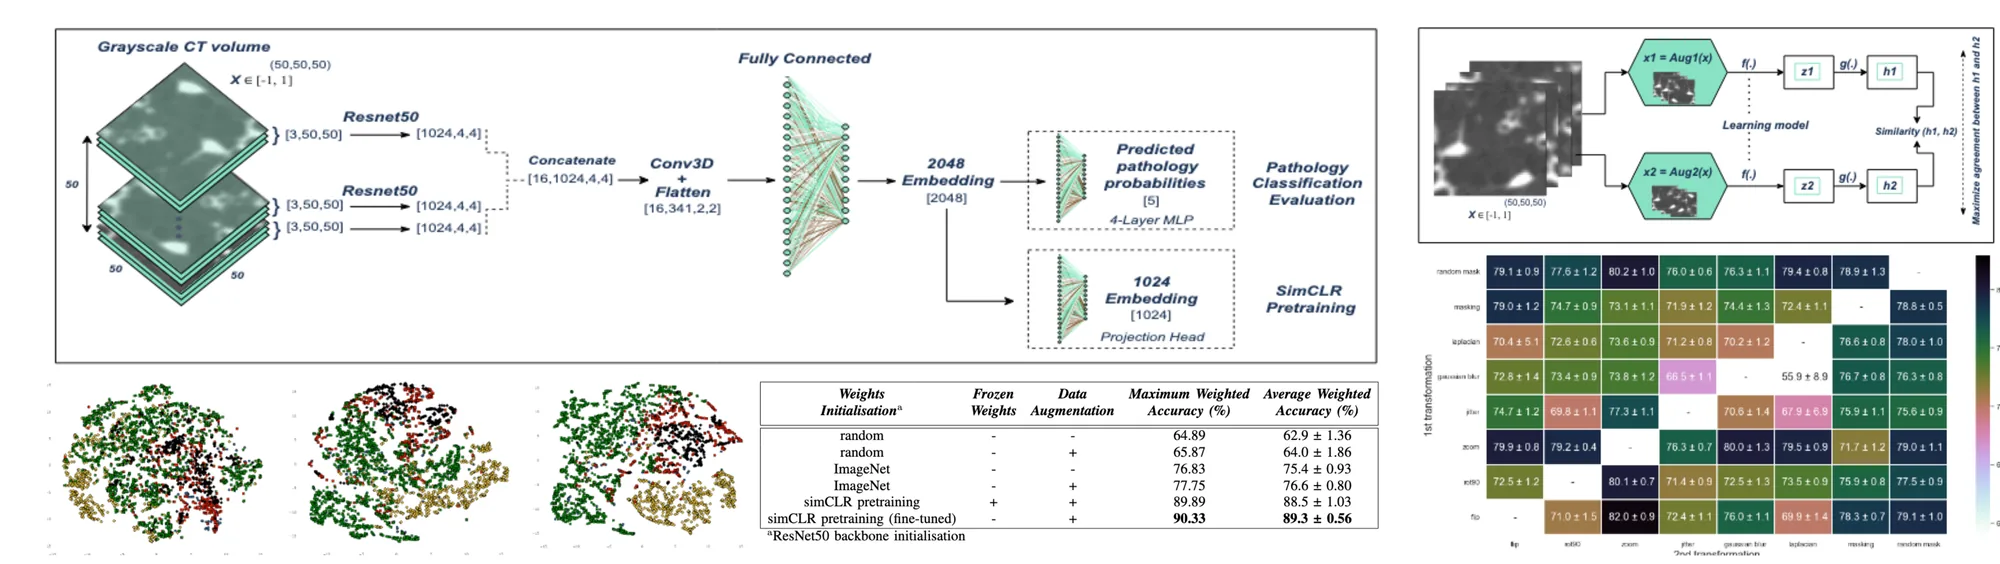
- Two correlated views. A transformation module T randomly alters each patch twice, xi = T(x) and xj = T(x), using domain-specific transformations.
- Encoder. CT-Net, a 2.5D alternative to 3D ResNets that allows ImageNet initialization: the patch is read as stacks of three-channel images by a 2D ResNet-50, combined, reduced by 3D convolutions and projected to a 2048-d representation h.
- Contrastive loss. A 2-layer MLP head g maps h to a 1024-d vector z, and the NT-Xent loss pulls the two views of the same patch together while pushing apart the other 2(N − 1) samples in the batch. The head is discarded after pretraining.
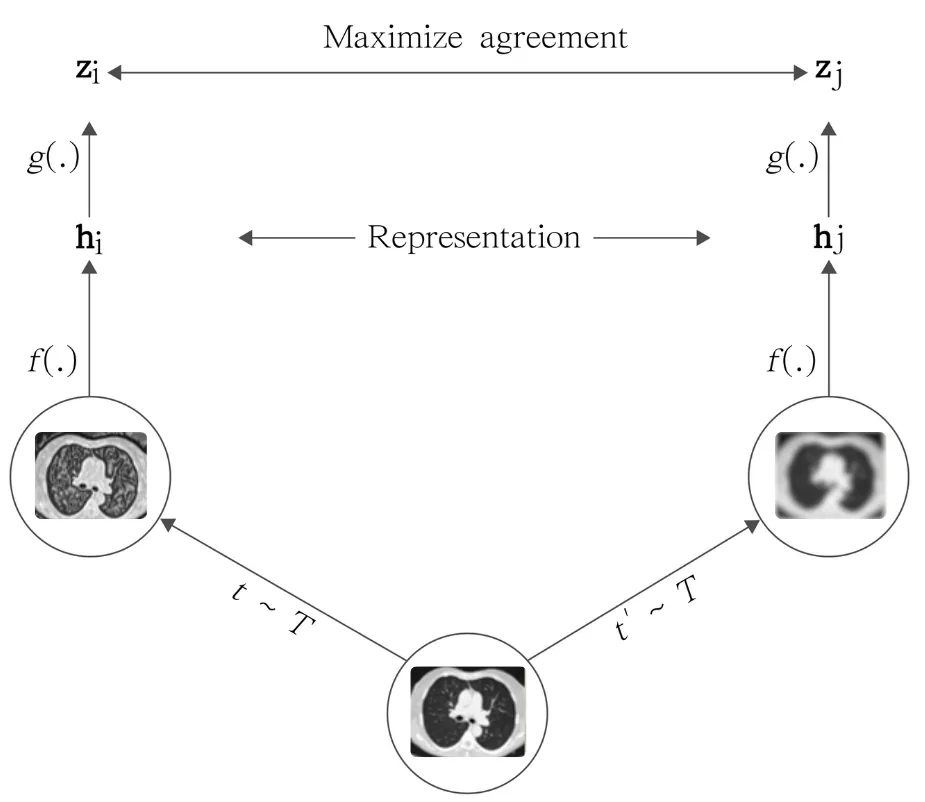
Pretraining runs on 256,000 random patches with Adam (learning rate 10⁻³), 1,000 epochs, batch size 256, L2 regularization 10⁻⁶ and cosine decay without restarts.
2.2Choosing the data transformations
Eight transformations common in medical imaging were studied: mirror, 90° rotation, zoom (random crop and resize), colour distortion, Gaussian blur, Laplacian, masking with the lung mask, and a random lung mask from another patient. Following Chen et al., each of the 56 ordered pairs was evaluated with a frozen pretrained encoder over 10 runs.
Table 3: Weighted mean accuracy (%, mean ± SD over 10 runs) of the frozen SimCLR patch classifier for each pair of data transformations. Rows: transformation 2; columns: transformation 1. Best pair in bold.
| T2 \ T1 | Mirror | Rotation 90° | Zoom | Colour distortion | Gaussian blur | Laplacian | Masking | Random mask |
|---|---|---|---|---|---|---|---|---|
| Random mask | 79.1 ± 0.9 | 77.6 ± 1.2 | 80.2 ± 1.0 | 76.0 ± 0.6 | 76.3 ± 1.1 | 79.4 ± 0.8 | 78.9 ± 1.3 | – |
| Masking | 79.0 ± 1.2 | 74.7 ± 0.9 | 73.1 ± 1.1 | 71.9 ± 1.2 | 74.4 ± 1.3 | 72.4 ± 1.1 | – | 78.8 ± 0.5 |
| Laplacian | 70.4 ± 5.1 | 72.6 ± 0.6 | 73.6 ± 0.9 | 71.2 ± 0.8 | 70.2 ± 1.2 | – | 76.6 ± 0.8 | 78.0 ± 1.0 |
| Gaussian blur | 72.8 ± 1.4 | 73.4 ± 0.9 | 73.8 ± 1.2 | 66.5 ± 1.1 | – | 55.9 ± 8.9 | 76.7 ± 0.8 | 76.3 ± 0.8 |
| Colour distortion | 74.7 ± 1.2 | 69.8 ± 1.1 | 77.3 ± 1.1 | – | 70.6 ± 1.4 | 67.9 ± 6.9 | 75.9 ± 1.1 | 75.6 ± 0.9 |
| Zoom | 79.9 ± 0.8 | 79.2 ± 0.4 | – | 76.3 ± 0.7 | 80.0 ± 1.3 | 79.5 ± 0.9 | 71.7 ± 1.2 | 79.0 ± 1.1 |
| Rotation 90° | 72.5 ± 1.2 | – | 80.1 ± 0.7 | 71.4 ± 0.9 | 72.5 ± 1.3 | 73.5 ± 0.9 | 75.9 ± 0.8 | 77.5 ± 0.9 |
| Mirror | – | 71.0 ± 1.5 | 82.0 ± 0.9 | 72.4 ± 1.1 | 76.0 ± 1.1 | 69.9 ± 1.4 | 78.3 ± 0.7 | 79.1 ± 1.0 |
Key findings
- Zoom is key: the best pairs all include zoom — mirror then zoom reaches 82.0%, zoom then random mask 80.2%, rotation then zoom 80.1%.
- Intensity changes hurt: Gaussian blur with Laplacian drops to 55.9%, and colour distortion consistently degrades accuracy (down to 66.5%), since Hounsfield values are essential to tell the signs apart.
- Final choice: random mask, mirror, 90° rotation and zoom, applied sequentially; the same set is used as data augmentation for the random and ImageNet baselines.
2.3Patch classifier
A 5-output classification head is added to the pretrained encoder and fine-tuned on 3,281 labelled patches (1,295 NORMAL, 550 LLDA, 377 CONS, 784 NOD, 275 IP) with categorical cross-entropy and dropout, SGD (learning rate 10⁻⁴), 500 epochs, batch size 256 and cosine decay. Six configurations are compared: random or ImageNet initialization trained end to end (with or without augmentation), and SimCLR pretraining with frozen weights or end-to-end fine-tuning.
2.4Patient-level classification and 3D localization
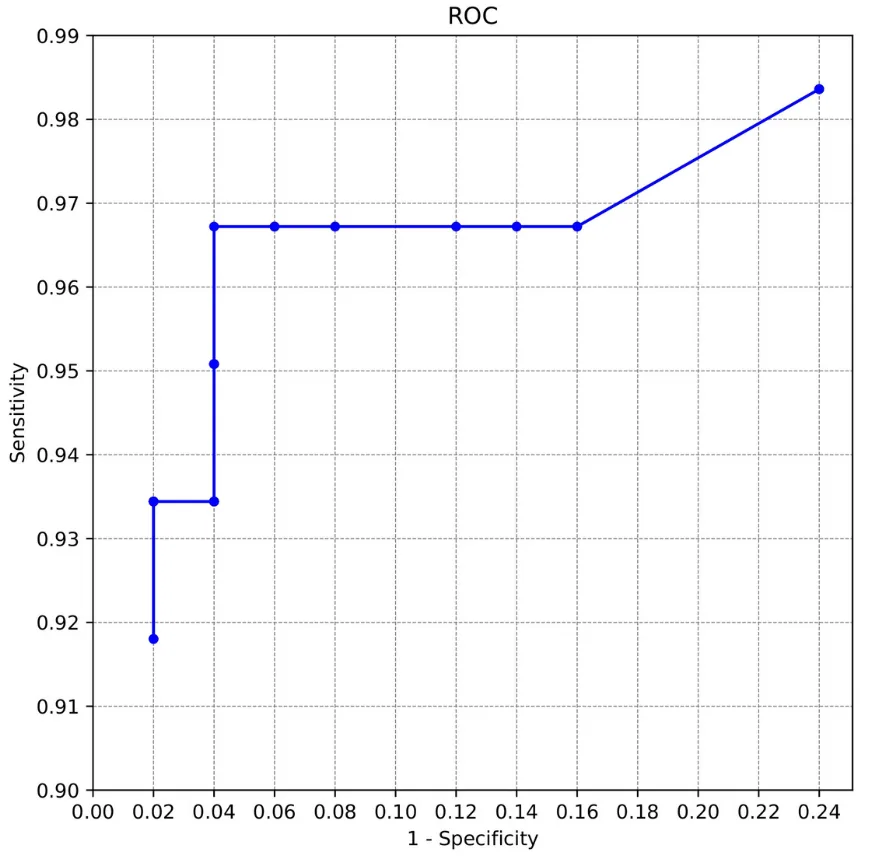
The patch classifier is swept over the whole scan with 50³ patches overlapping by 10 voxels, producing a likelihood map for each of the 5 labels, smoothed by a per-class Gaussian convolution. Because training patches cover at least 80% lung, border patches create a domain shift at inference; normal-lung filling fills the regions outside the lung mask with healthy lung texture matched to the scan's dose, contrast and slice thickness. The maps are then binarized and filtered, and a threshold T on the volume of pathological regions decides whether the exam is abnormal. T is chosen on the validation ROC curve: T = 7.5 cm³.
Experiments
3.1Data
An internal dataset of 3,029 chest CT scans of unique patients from Hospices Civils de Lyon (2019), acquired on Philips, Siemens, Toshiba and GE scanners and selected by an expert radiologist for relevant abnormalities, image quality and diversity of semiological signs. Lungs are segmented automatically; voxels are windowed to [−1000, +200] HU and normalized to [−1, +1].
Table 2: Dataset statistics (mean ± SD, with range).
| Patients | Sex | Labels | Age (years) | Slice thickness (mm) | Pixel spacing (mm) | kVp |
|---|---|---|---|---|---|---|
| 3,029 | 1,734 M · 1,295 F | 1,482 normal · 1,547 abnormal | 58.19 ± 17.07 (18–98) | 2.21 ± 0.82 (0.625–3.00) | 0.75 ± 0.12 (0.312–1.4) | 116.4 ± 10.42 (80–140) |
Table 1: Partition of the CT dataset (3,029 scans from Hospices Civils de Lyon, 2019).
| Partition | Use | Scans | Details |
|---|---|---|---|
| (i) | SimCLR pretraining | 1,337 | 256,000 randomly selected patches |
| (ii) | Patch-classifier fine-tuning | 1,330 | 1,850 NORMAL · 786 LLDA · 539 CONS · 1,120 NOD · 393 IP patches |
| (iii) | Patient-level classification | 362 | Validation: 111 scans · Test: 251 scans |
Metrics: precision, recall, F1, AUROC and DeLong p-values, at patch and patient level, in multi-label and binary settings. Localization is assessed qualitatively by an experienced radiologist on 100 random test cases, scoring completeness and false positives from 1 to 4.
3.2Representation learning
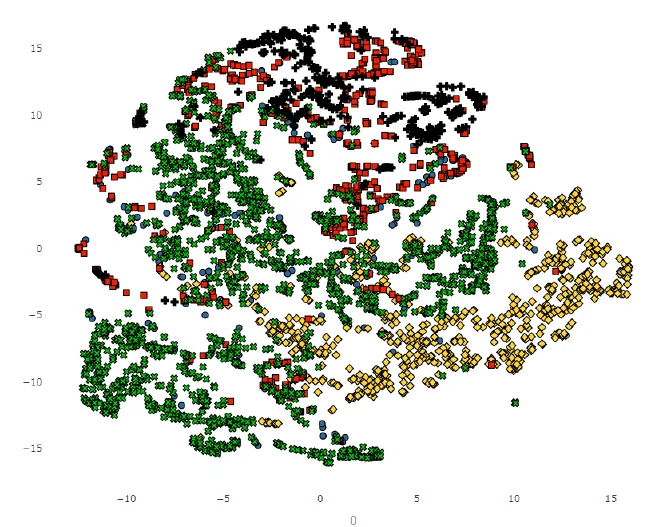
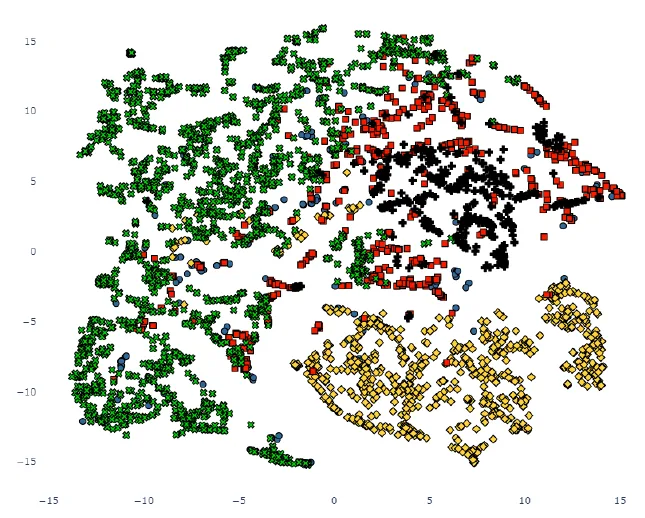
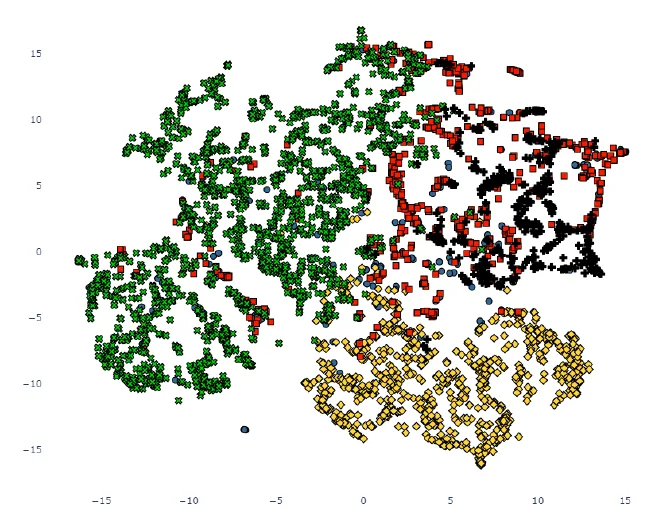
Key findings
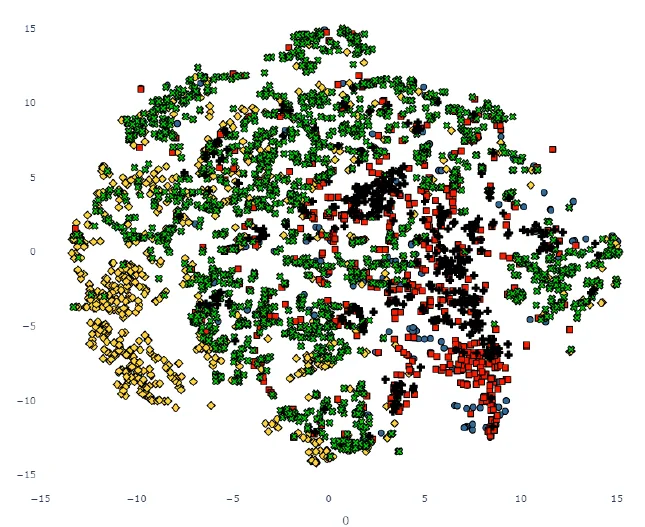
- Structured latent space: clusters matching each semiological sign appear clearly only after SimCLR pretraining and fine-tuning; random and ImageNet encoders mix the classes.
3.3Patch-level classification
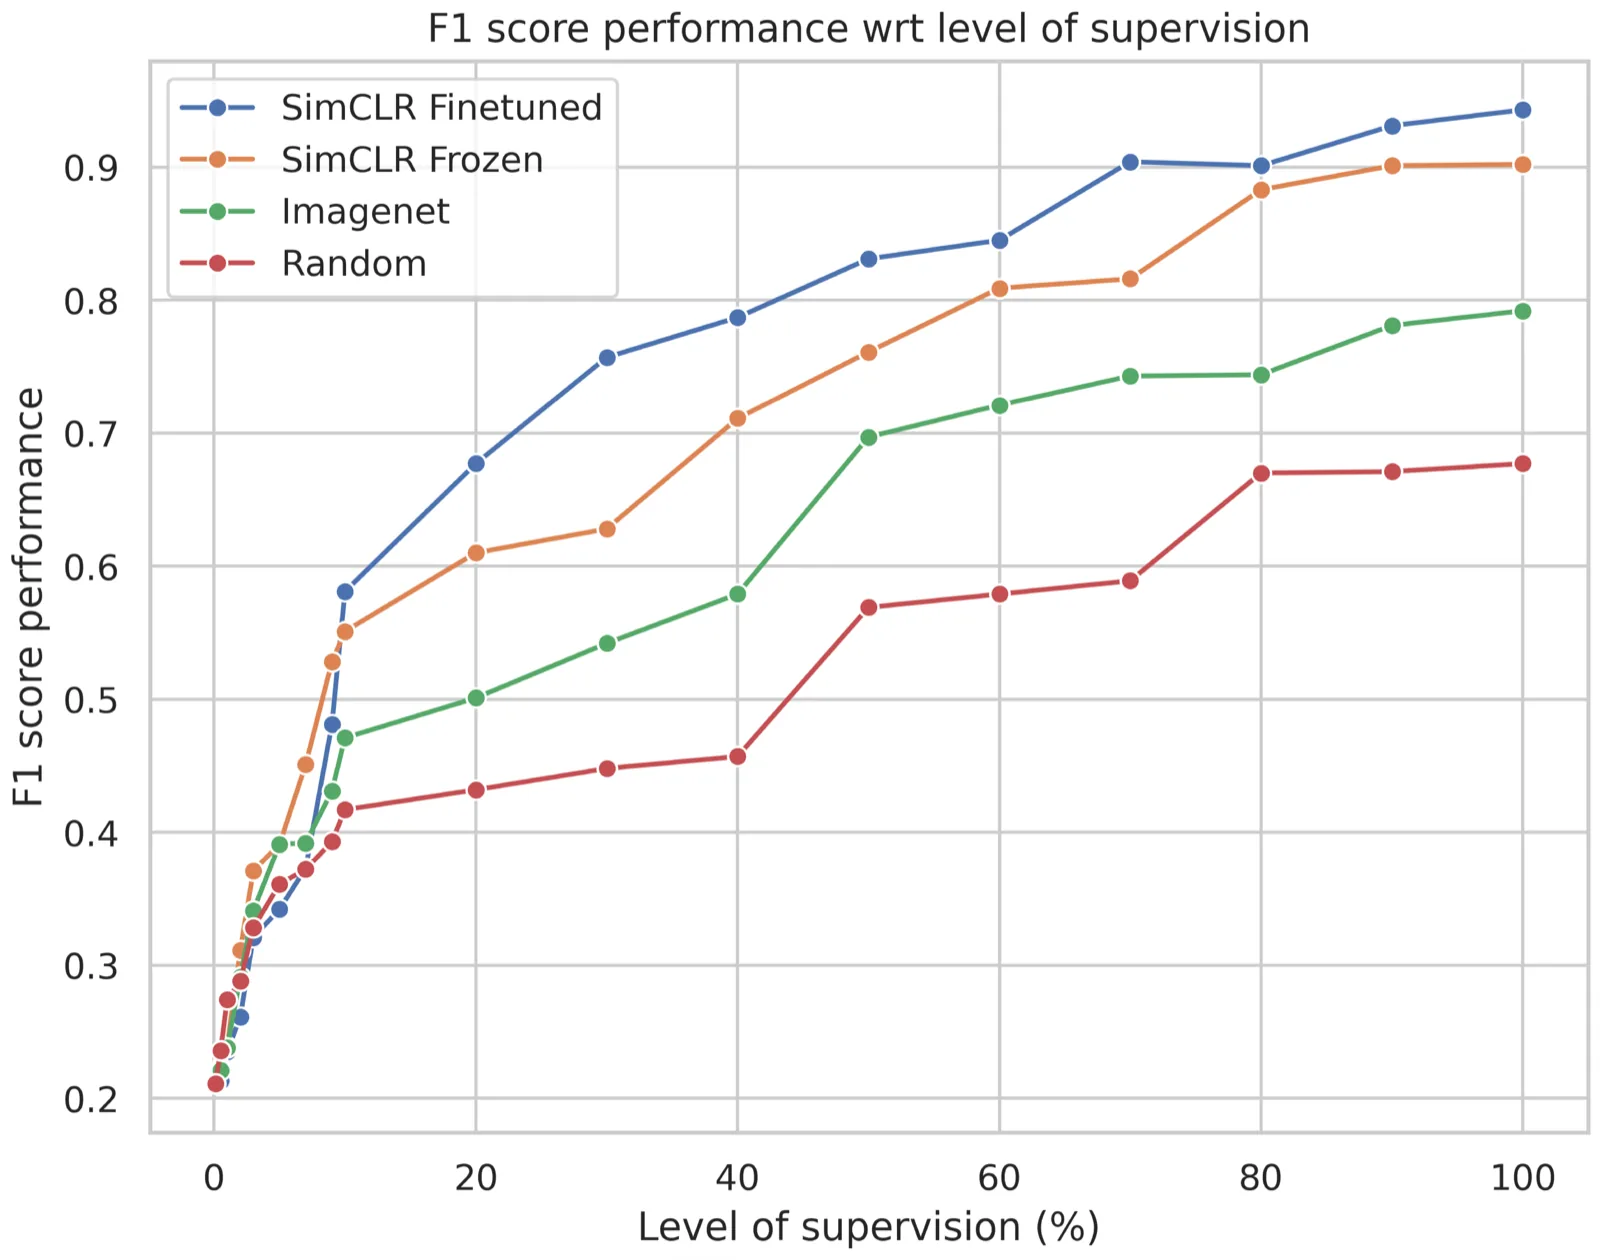
The patch test set contains 236 LLDA, 162 CONS, 336 NOD, 118 IP and 555 NORMAL patches. SimCLR pretraining with fine-tuning reaches an F1 score of 0.943, against 0.677 for random weights, 0.792 for ImageNet and 0.902 for frozen SimCLR weights.
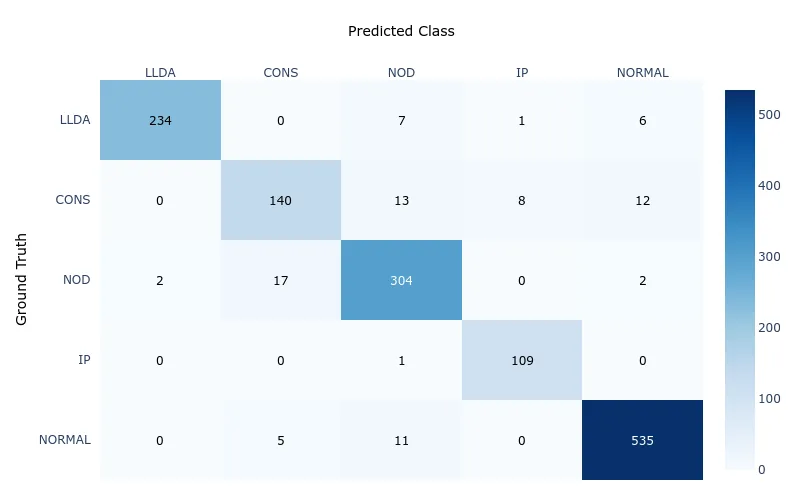
Key findings
- Label efficiency: SimCLR with fine-tuning outperforms every other strategy at every level of supervision, and is already strong from 30% of the labels.
- No plateau: all strategies keep improving with more labels, and the gap in favour of SimCLR fine-tuning holds.
3.4Patient-level classification
Table 4: Patient-level multi-label classification for each training configuration. Weight initialization refers to the ResNet50 backbone; normal-lung filling is applied at inference. Best in bold, second best underlined.
| Initialization | Frozen | Lung filling | AUROC (95% CI) | Jaccard | F1 | DeLong p |
|---|---|---|---|---|---|---|
| Random | – | – | 0.651 (0.6228, 0.6749) | 0.404 | 0.568 | < 1.103 × 10⁻⁸ |
| Random | – | ✓ | 0.679 (0.6499, 0.7086) | 0.428 | 0.594 | < 4.875 × 10⁻⁷ |
| ImageNet | – | – | 0.701 (0.6663, 0.7348) | 0.459 | 0.623 | < 1.259 × 10⁻⁶ |
| ImageNet | – | ✓ | 0.767 (0.7364, 0.8067) | 0.540 | 0.693 | < 2.001 × 10⁻⁴ |
| SimCLR | ✓ | – | 0.841 (0.8115, 0.8617) | 0.642 | 0.770 | < 3.945 × 10⁻⁵ |
| SimCLR | ✓ | ✓ | 0.874 (0.8343, 0.9109) | 0.711 | 0.819 | < 1.789 × 10⁻⁷ |
| SimCLR (fine-tuned) | – | – | 0.902 (0.8795, 0.9303) | 0.755 | 0.856 | < 9.412 × 10⁻⁹ |
| SimCLR (fine-tuned) | – | ✓ | 0.931 (0.9034, 0.9557) | 0.819 | 0.897 | < 5.673 × 10⁻⁴ |
Table 5: Per-abnormality performance of the best configuration (SimCLR pretraining + fine-tuning) on the test set.
| Abnormality | Positive cases | AUROC | Precision | Recall | F1 |
|---|---|---|---|---|---|
| LLDA (low lung density) | 81 | 0.952 | 0.894 | 1 | 0.944 |
| CONS (consolidation) | 66 | 0.791 | 0.809 | 0.739 | 0.772 |
| NOD (nodules) | 51 | 0.853 | 0.732 | 0.976 | 0.837 |
| IP (interstitial pattern) | 66 | 0.974 | 1 | 0.909 | 0.952 |
| NORMAL | 60 | 0.948 | 0.964 | 0.916 | 0.939 |
Table 6: Normal versus abnormal classification; all pathologies are merged into one “abnormal” label.
| Initialization | Frozen | AUROC (95% CI) | F1 | DeLong p |
|---|---|---|---|---|
| Random | – | 0.789 (0.765, 0.820) | 0.864 | < 8.413 × 10⁻⁹ |
| ImageNet | – | 0.796 (0.776, 0.823) | 0.878 | < 2.152 × 10⁻⁸ |
| SimCLR | ✓ | 0.947 (0.917, 0.951) | 0.9467 | < 1.489 × 10⁻⁴ |
| SimCLR (fine-tuned) | – | 0.963 (0.952, 0.976) | 0.974 | < 7.231 × 10⁻⁶ |
Key findings
- Pretraining matters: SimCLR fine-tuning with normal-lung filling reaches AUROC 0.931 on multi-label classification, against 0.651 from random initialization and 0.767 from ImageNet.
- Normal-lung filling helps every configuration, notably for nodules and interstitial pattern.
- Diffuse vs focal: diffuse signs are detected best (IP 0.974, LLDA 0.952) and focal ones are harder (NOD 0.853, CONS 0.791), in line with previous studies.
- Triage: normal versus abnormal reaches AUROC 0.963 with F1 0.974.
3.5Qualitative results: 3D localization
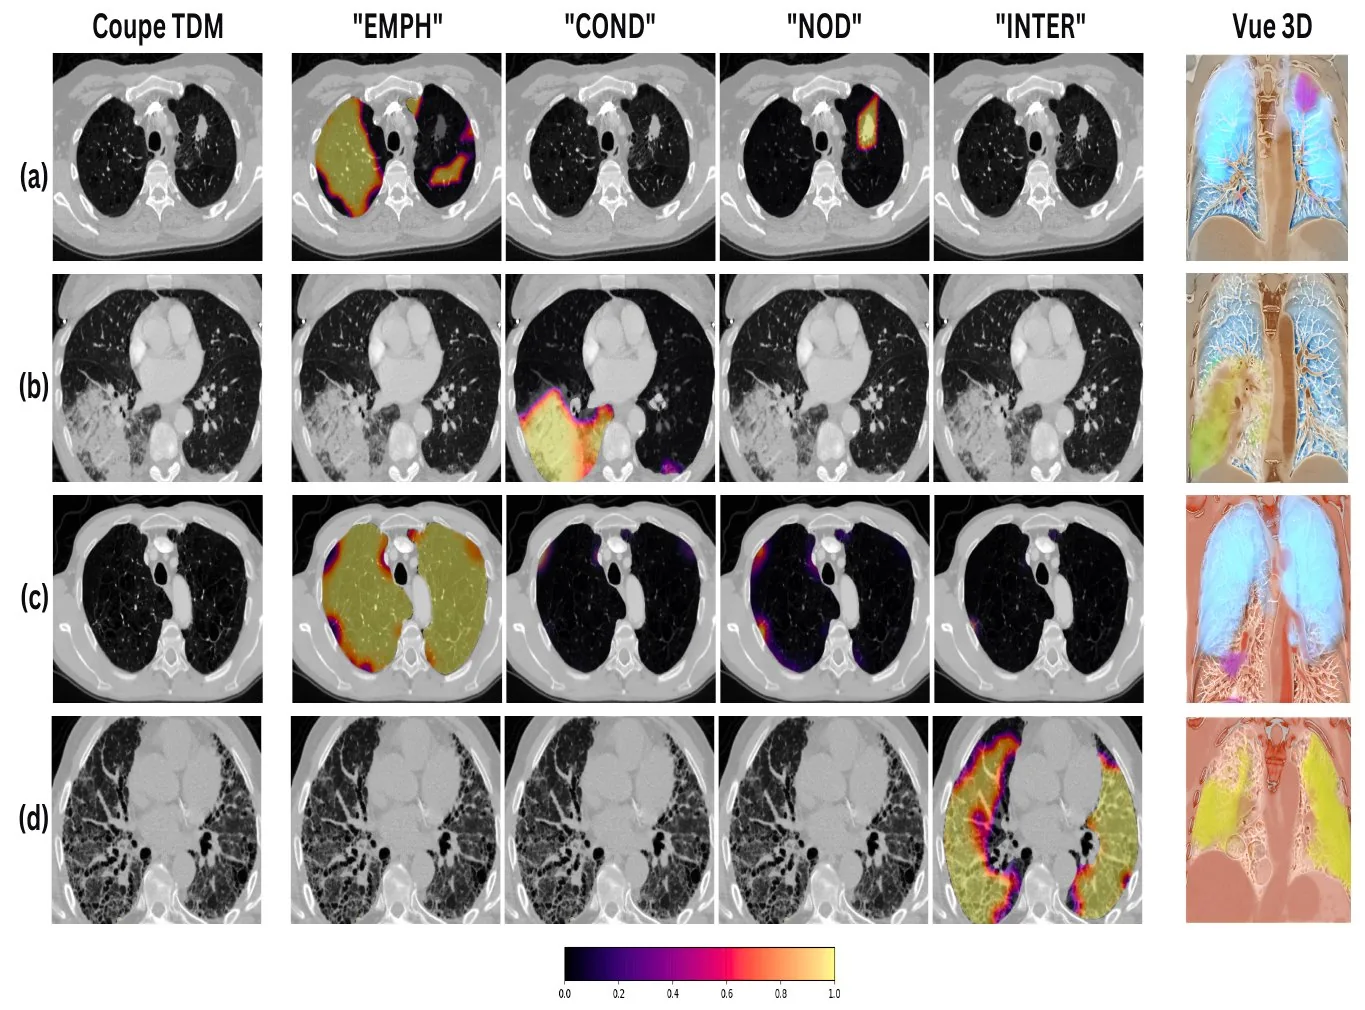
Table 7: Radiologist review of localization on 119 findings from 100 randomly selected test patients (% of findings per score).
| Criterion | 4 | 3 | 2 | 1 |
|---|---|---|---|---|
| Completeness | 62.6 complete | 16.2 clinically relevant | 10.1 partial | 11.1 insufficient |
| False positives | 47.1 none | 26.1 few | 15.1 significant | 11.7 unusable |
Key findings
- Completeness: a useful alert in 88.8% of findings — 62.6% complete, 16.2% clinically relevant and 10.1% partial; only 11.1% insufficient.
- False positives: 88.3% of findings usable — 47.1% with no false positives, 26.1% with few and 15.1% with significant ones; 11.7% unusable.
3.6Comparison with prior work
Table 8: Indicative comparison with prior work (AUROC). Datasets and label definitions differ, so values are not directly comparable. Atelectasis is compared with our CONS label.
| Method | Nodules | Atelectasis / CONS | Emphysema / LLDA |
|---|---|---|---|
| Tushar et al. | 0.65 | 0.77 | 0.89 |
| Saha et al. | – | 0.808 | 0.922 |
| Draelos et al. (CT-Net) | 0.718 | 0.765 | – |
| Ours | 0.853 | 0.791 | 0.952 |
Conclusion & limitations
Combining self-supervised pretraining with fine-tuning on a small set of labelled patches exploits large amounts of unlabelled data while keeping the precision of targeted supervision. Aggregating detected signs at patient level, together with simultaneous 3D localization, identifies and visualizes the affected regions, supporting the detection of incidental findings. Patch-level labels are easier and less ambiguous to annotate than whole exams, and tie each label directly to the relevant image features.
The patient-level aggregation remains simple. Evaluating on larger and more diverse datasets, other imaging settings and real clinical workflows is needed to confirm robustness and generalizability.
Related links
- Weakly-Supervised learning based Pathology Detection and Localization in 3D Chest Scans, Medical Physics, 2024.
- Automatic Detection of Pathologies in Conventional Scanner Data, PhD thesis, INSA Lyon, 2024 — chapter 3 (source of the tables and figures on this page).
- Tailored 3D CT contrastive pretraining to improve pulmonary pathology classification, IEEE ICSP, 2022 — the earlier contrastive pretraining study.
- T. Chen et al., A Simple Framework for Contrastive Learning of Visual Representations (SimCLR), ICML 2020.
- R. L. Draelos et al., Machine-learning-based multiple abnormality prediction with large-scale chest CT volumes (CT-Net), Medical Image Analysis, 2021.
BibTeX
@article{djahnine2024weakly,
  title = {Weakly-Supervised learning based Pathology Detection and Localization in 3D Chest Scans},
  author = {Djahnine, A. and Jupin-Delevaux, E. and Nempont, O. and Craighero, F. and
            Si-Mohamed, S. A. and Cottin, V. and Douek, P. and Popoff, A. and Boussel, L.},
  journal = {Medical Physics},
  volume = {51},
  number = {11},
  pages = {8272--8282},
  year = {2024}
}