Pulmonary Embolism Detection & Severity Quantification
Deep Learning on 3D CT Angiography
Abstract
Purpose: The purpose of this study was to propose a deep learning-based approach to detect pulmonary embolism and quantify its severity using the Qanadli score and the right-to-left ventricle diameter (RV/LV) ratio on three-dimensional (3D) computed tomography pulmonary angiography (CTPA) examinations with limited annotations.
Materials and methods: Using a database of 3D CTPA examinations of 1268 patients with image-level annotations, and two other public datasets of CTPA examinations from 91 (CAD-PE) and 35 (FUME-PE) patients with pixel-level annotations, a pipeline consisting of: (i), detecting blood clots; (ii), performing PE-positive versus negative classification; (iii), estimating the Qanadli score; and (iv), predicting RV/LV diameter ratio was followed. The method was evaluated on a test set including 378 patients. The performance of PE classification and severity quantification was quantitatively assessed using an area under the curve (AUC) analysis for PE classification and a coefficient of determination (R²) for the Qanadli score and the RV/LV diameter ratio.
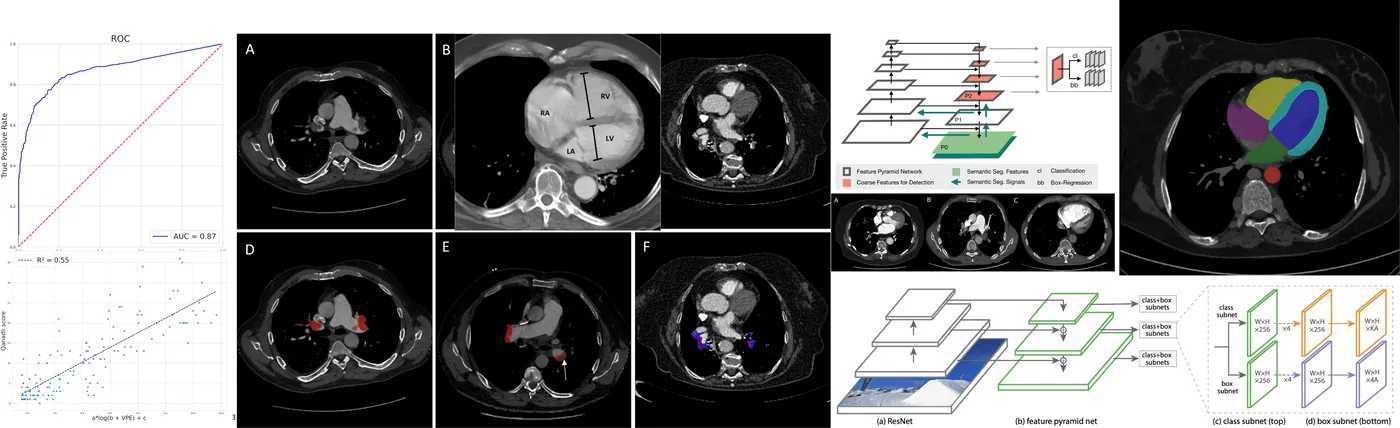
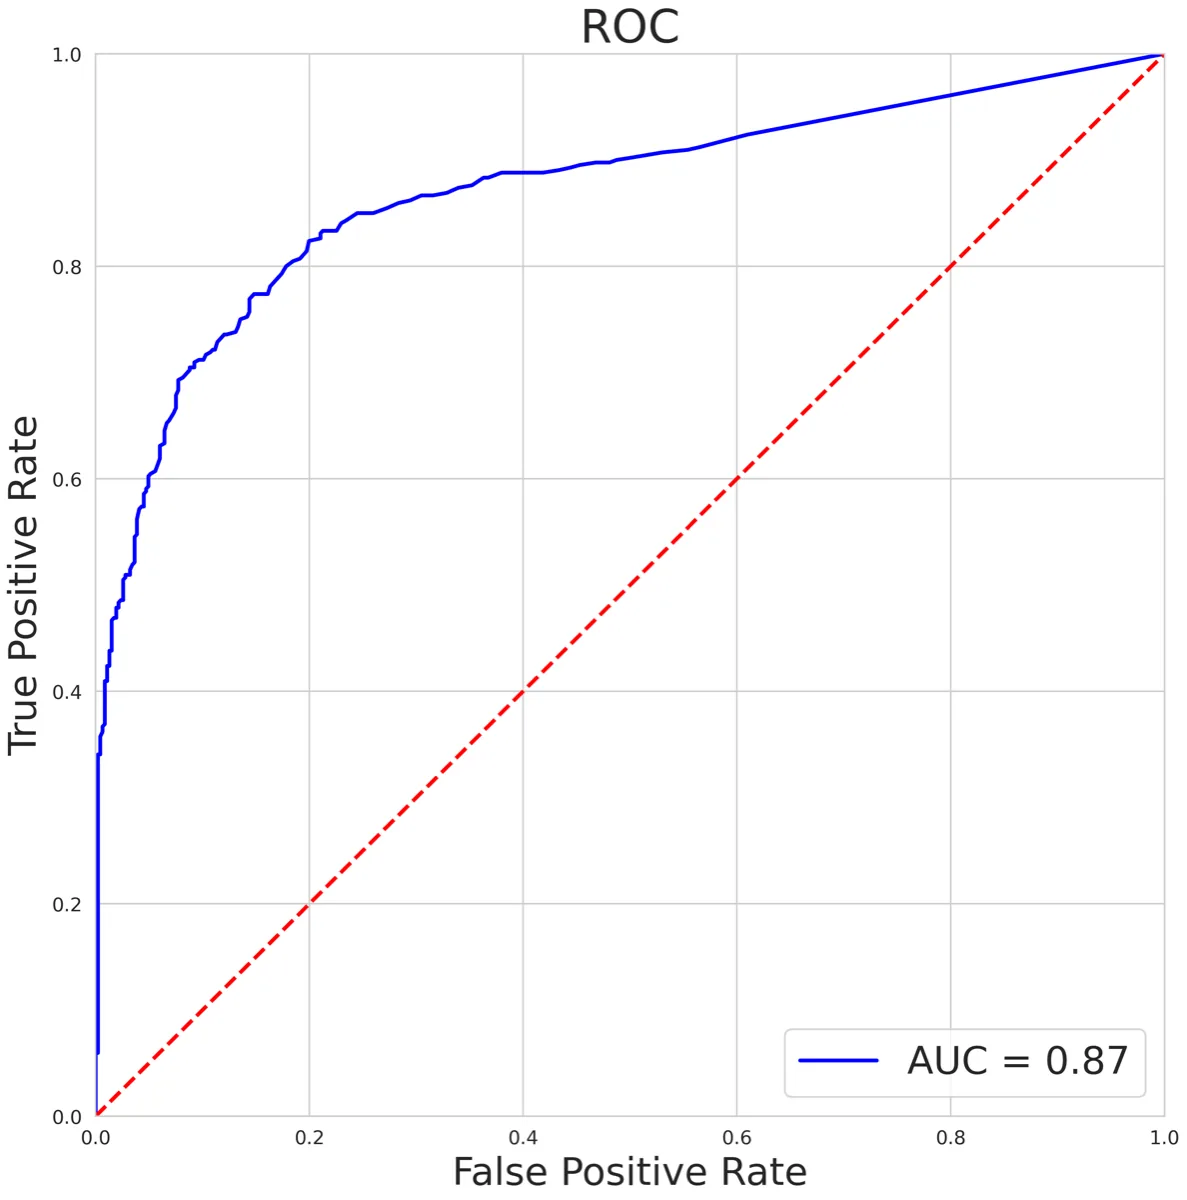
Results: Quantitative evaluation led to an overall AUC of 0.870 (95% confidence interval [CI]: 0.850–0.900) for PE classification task on the training set and an AUC of 0.852 (95% CI: 0.810–0.890) on the test set. Regression analysis yielded R² value of 0.717 (95% CI: 0.668–0.760) and of 0.723 (95% CI: 0.668–0.766) for the Qanadli score and the RV/LV diameter ratio estimation, respectively on the test set.
Conclusion: This study shows the feasibility of utilizing AI-based assistance tools in detecting blood clots and estimating PE severity scores with 3D CTPA examinations. This is achieved by leveraging blood clots and cardiac segmentations. Further studies are needed to assess the effectiveness of these tools in clinical practice.
Keywords: Artificial intelligence; Pulmonary embolism; Qanadli score; Retina U-net
Method
The pipeline segments blood clots in the 3D exam, uses the segmentations to classify PE and estimate the Qanadli score, and segments the heart to estimate the RV/LV diameter ratio.
2.1Blood clot segmentation
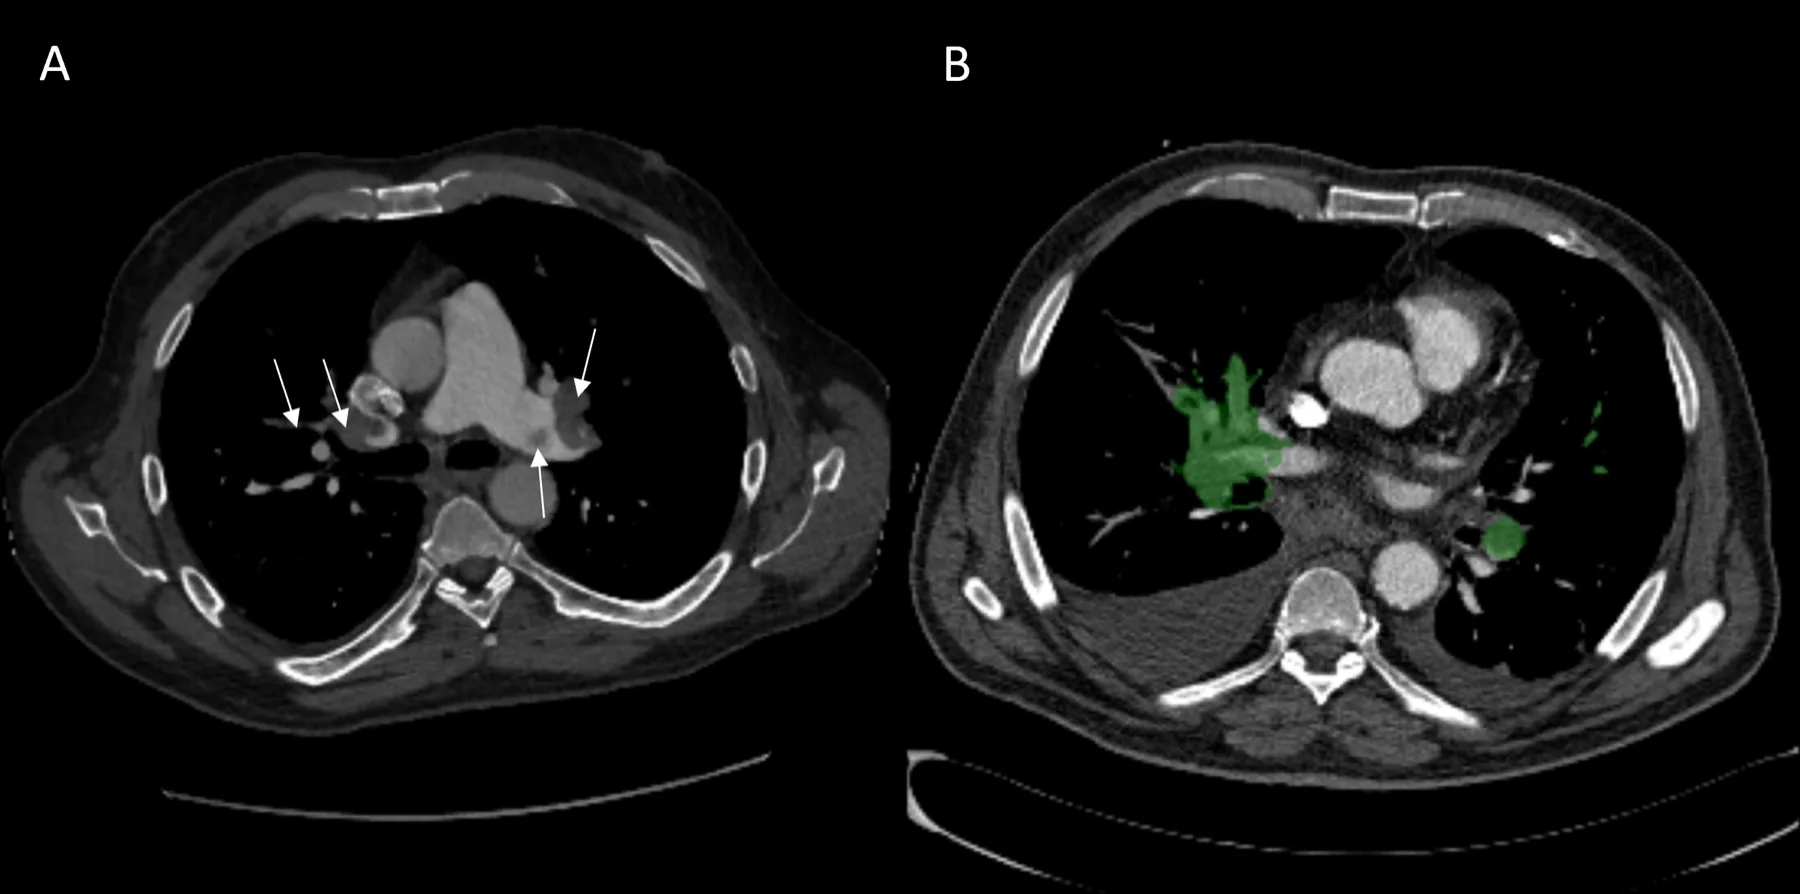
Instance segmentation detects and segments each clot individually, giving their number and volume. A 3D approach is used because it outperforms 2D and 2.5D approaches by exploiting volumetric context. The 3D Retina U-Net combines RetinaNet for object detection with U-Net for precise segmentation: a feature pyramid captures fine detail and global context, and an auxiliary network classifies objects and regresses their bounding boxes. It is trained on CAD-PE and FUM-PE with nnDetection, a self-configuring framework for medical object detection in the spirit of nnU-Net.
2.2PE classification
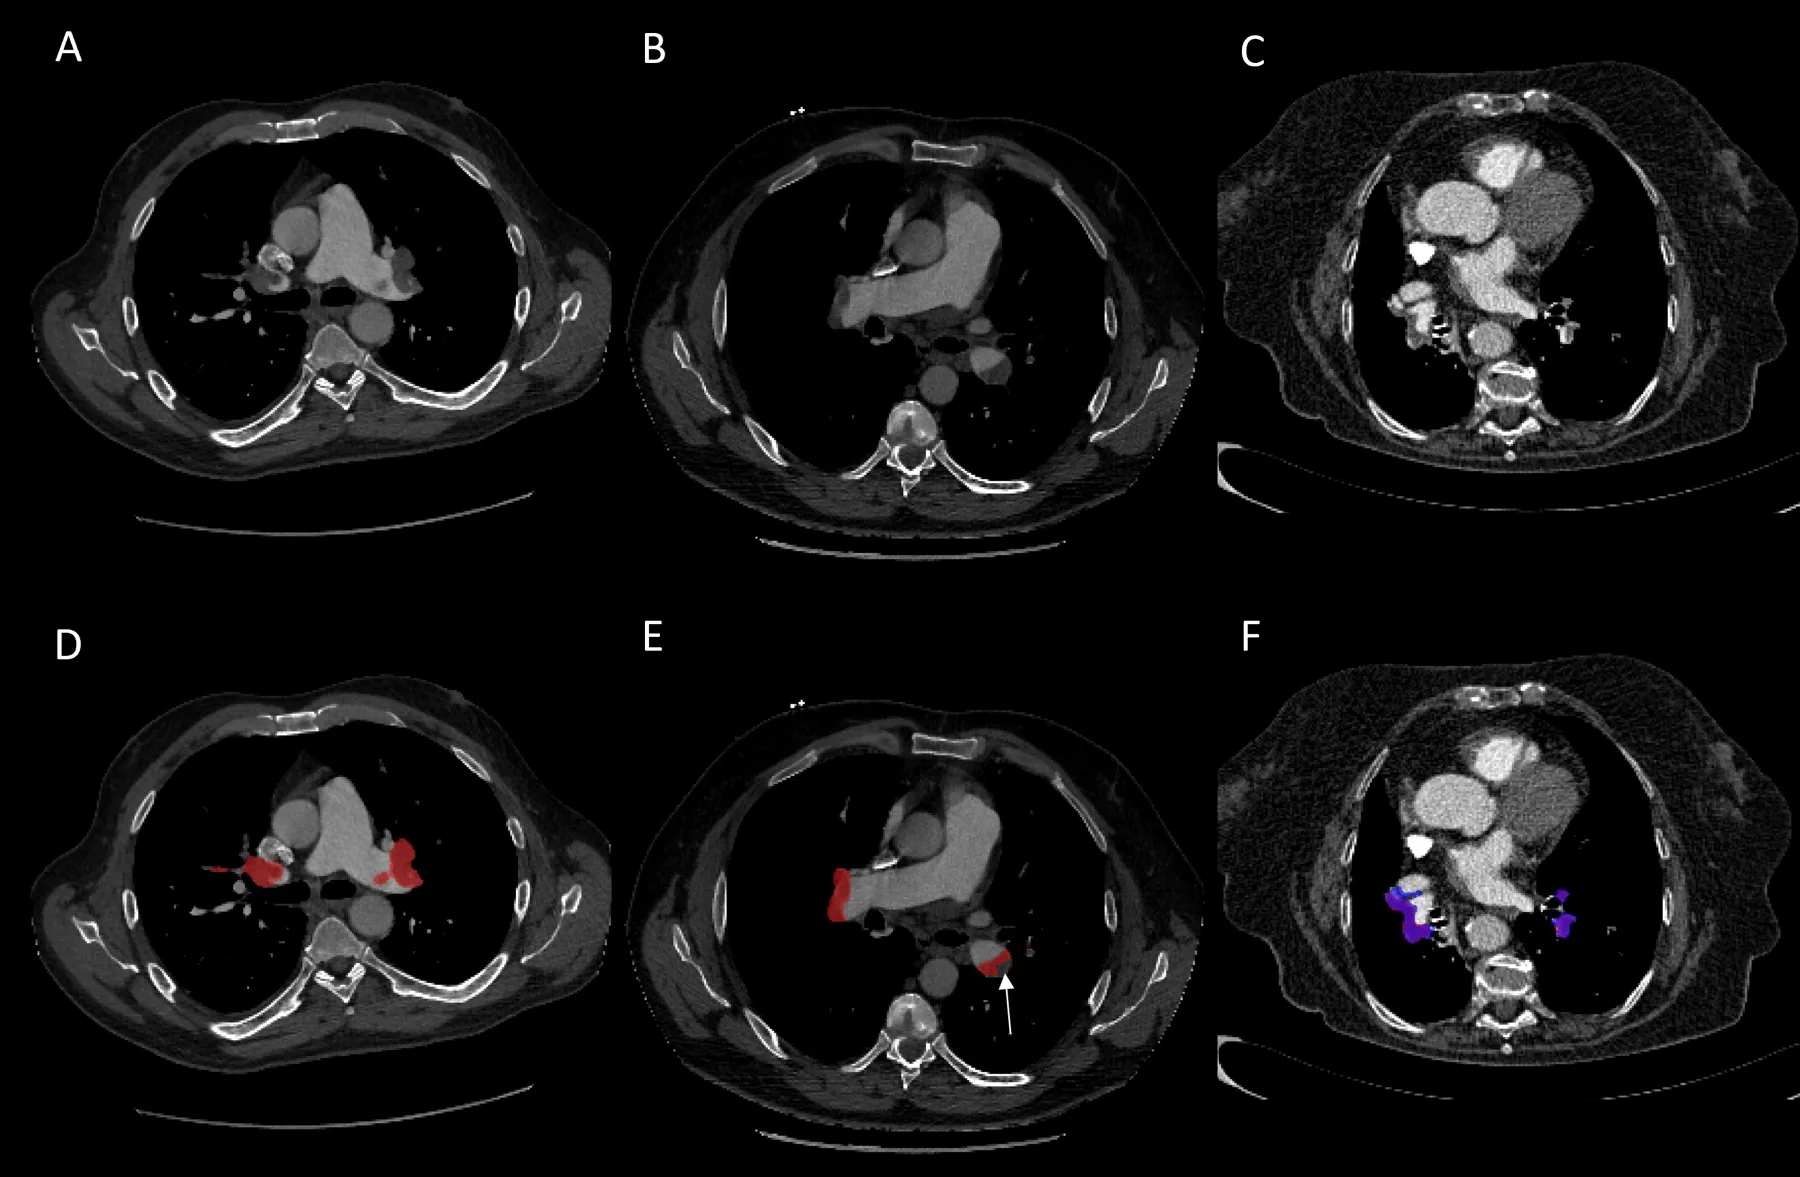
Two approaches are compared. Image-level annotation: inspired by the winning solution of the RSNA-STR Kaggle challenge, a 2D EfficientNet reads each slice with its two neighbours (2.5D), and a recurrent network processes the sequence of slice representations to output the probability of PE. Segmentation-based annotation: the clot segmentation is applied to each exam and the normalized total clot volume VPE serves as the predictor, with a threshold optimized on the training set.
2.3Qanadli score
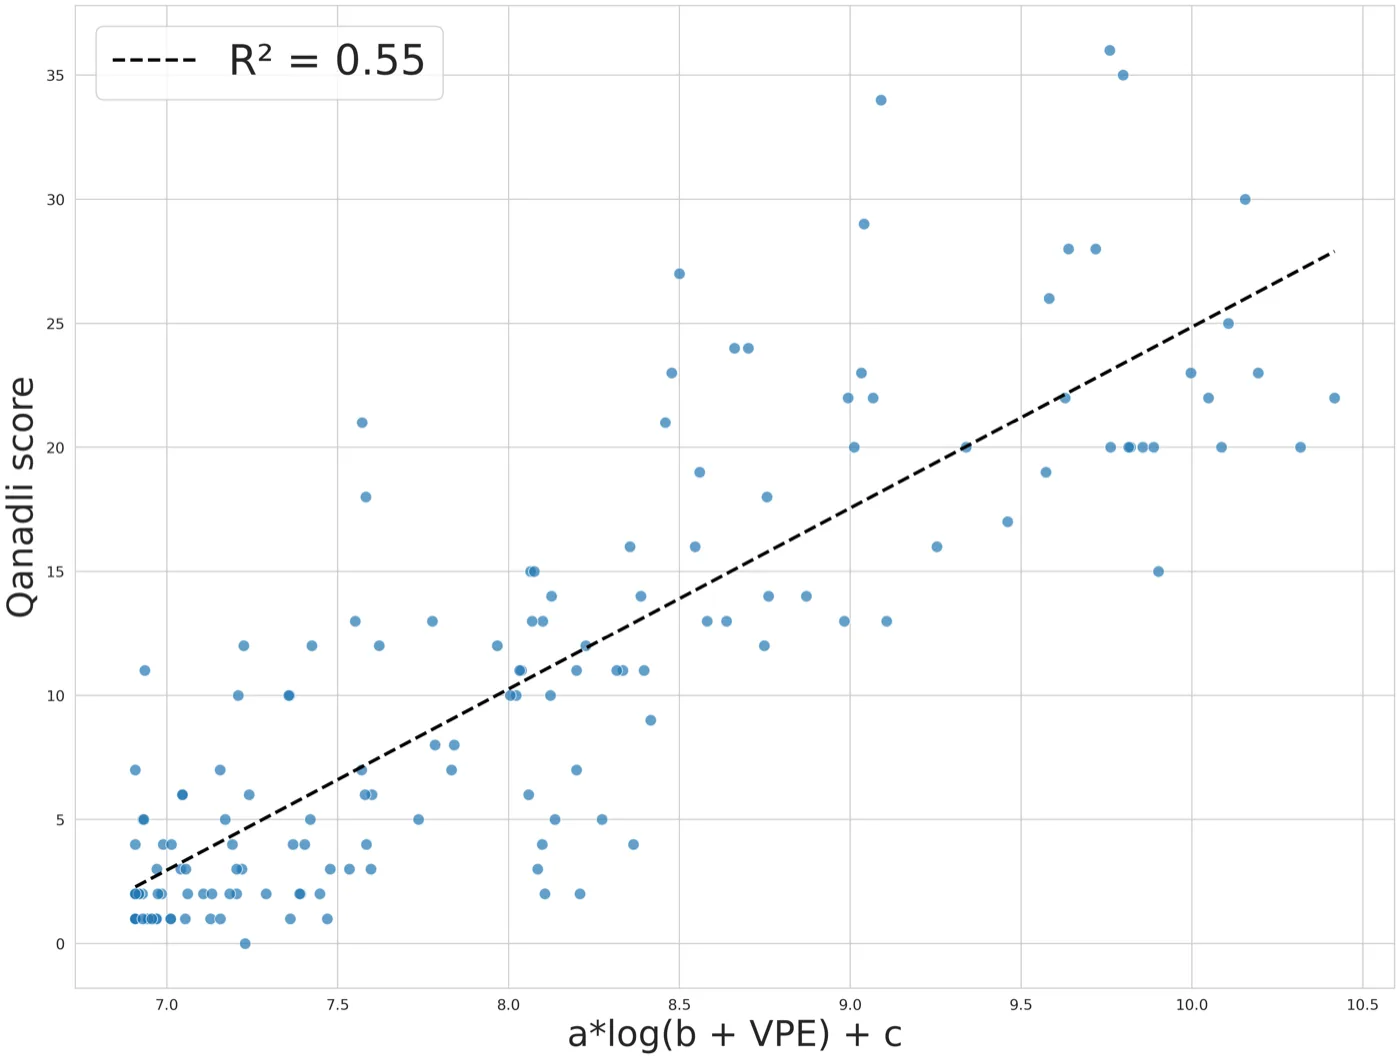
The Qanadli score requires detecting and counting the branches containing a clot and locating them in the pulmonary arterial tree. Observing a strong correlation between the score and the total clot volume, several approximations were tested (power law, logarithmic); the best in R² is logarithmic:
ScoreQanadli = a · log(b + VPE) + c
with a = 0.606, b = 1000 and c = −37.813 fitted by least squares on the EP-Detect training set.
2.4RV/LV diameter ratio
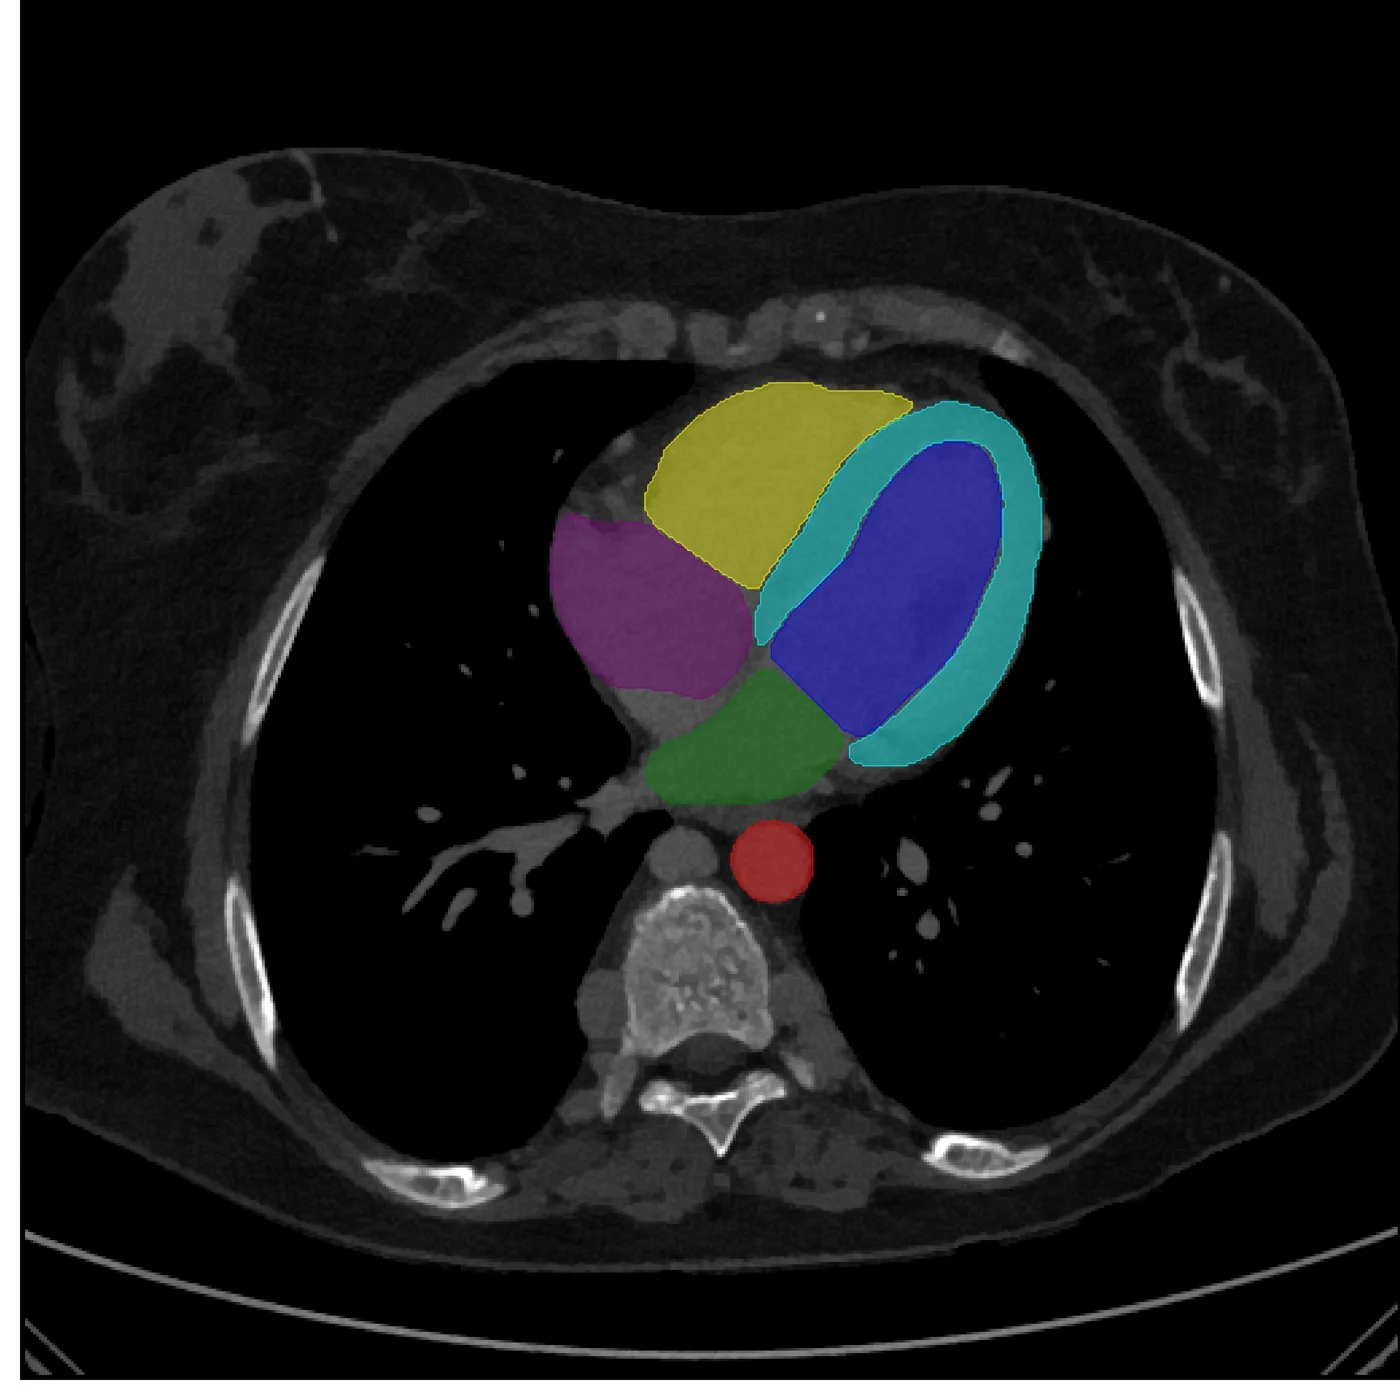
The RV/LV ratio, a key indicator of cardiac function, compares the maximal inner diameters of the right and left ventricles on the axial slice closest to the four-chamber view. The cardiac structures are segmented, distance maps are computed in each ventricle to obtain the diameters, and a linear regression calibrates the estimated ratios against the reference values.
Experiments
3.1Data
Table 1: Datasets used in this work.
| Dataset | Exams | Annotation | Use |
|---|---|---|---|
| EP-Detect (JFR 2022 challenge) | 1,268 CTPA from 25 French institutions | PE label, RV/LV ratio, Qanadli score (0–40) | 890 training (423 PE-positive) · 378 test |
| CAD-PE (ISBI challenge) | 91 PE-positive | Expert clot segmentation masks | Clot segmentation training / validation |
| FUM-PE | 35 PE-positive | Expert clot segmentation masks | Clot segmentation training / validation |
| RSNA-STR (Kaggle) | 7,279 studies | Slice- and study-level labels | Image-level classification approach |
Segmentation is validated on 25 held-out exams from CAD-PE and FUM-PE (7 and 18 exams, 20% of the data) with the Dice coefficient; classification is validated on a held-out part of EP-Detect with the AUC.
3.2Blood clot segmentation
Clot segmentation reaches a Dice coefficient of 0.784 on the validation set of CAD-PE and FUM-PE.
3.3PE classification
Table 2: PE classification: image-level versus segmentation-based annotation (AUC).
| Classification approach | Validation | Test |
|---|---|---|
| Image-level annotation (EfficientNet 2.5D + RNN) | 0.792 | – |
| Segmentation-based annotation (clot volume) | 0.866 | 0.852 |
Key findings
- Fine labels win: the segmentation-based approach, built from the 126 pixel-annotated exams of CAD-PE and FUM-PE, beats the classifier trained on thousands of image-level labels (0.866 vs 0.792 validation AUC).
- Generalization: it holds on the test set with an AUC of 0.852.
3.4Severity: Qanadli score and RV/LV ratio
The logarithmic model of the Qanadli score reaches R² = 0.717 on the EP-Detect test set, and the RV/LV regression R² = 0.723, showing good agreement with the reference measurements.
3.5JFR 2022 data challenge
Table 3: JFR 2022 data challenge on the EP-Detect test set. R² is computed on PE-positive patients only; the total score is the mean of the three metrics.
| Team | PE classification (AUC) | RV/LV ratio (R²) | Qanadli score (R²) | Total score |
|---|---|---|---|---|
| Second place | 0.862 | 0.644 | 0.511 | 0.673 |
| Ours (first place) | 0.852 | 0.723 | 0.717 | 0.764 |
Table 4: Summary of results with 95% confidence intervals, as reported in the paper.
| Task | Metric | Value | 95% CI |
|---|---|---|---|
| Clot segmentation | Dice coefficient (validation) | 0.784 | – |
| PE classification (training) | AUC | 0.870 | 0.850–0.900 |
| PE classification (test) | AUC | 0.852 | 0.810–0.890 |
| Qanadli score (test) | R² | 0.717 | 0.668–0.760 |
| RV/LV diameter ratio (test) | R² | 0.723 | 0.668–0.766 |
Key findings
- First place overall with a total score of 0.764, ahead of 0.673 for the second team.
- Severity makes the difference: the second team had a slightly higher AUC (0.862), but our severity estimates were much better (R² 0.723 vs 0.644 and 0.717 vs 0.511).
Conclusion & limitations
This automated method assists PE diagnosis on CTPA by detecting clots and quantifying severity with the Qanadli score and the RV/LV ratio. Developed for the JFR 2022 data challenge organized by the Société Française de Radiologie, it took first place. The Qanadli approximation greatly simplifies the original score, but the strong correlation with clot volume makes it effective.
Fine segmentation labels, even in small quantity, outperformed a classifier trained on large amounts of coarse labels. Building large finely-annotated databases is costly and time-consuming, which suits pathology-specific decision support but not the broad coverage needed for general anomaly detection — motivating the weakly-supervised and unsupervised approaches that followed.
Related links
- Detection and severity quantification of pulmonary embolism with 3D CT data using an automated deep learning-based artificial solution, Diagnostic and Interventional Imaging, 2024.
- Automatic Detection of Pathologies in Conventional Scanner Data, PhD thesis, INSA Lyon, 2024 — chapter 2 (source of the tables and figures on this page).
- JFR 2022 data challenge paper, Diagnostic and Interventional Imaging.
- P. F. Jaeger et al., Retina U-Net: Embarrassingly simple exploitation of segmentation supervision for medical object detection, 2020.
- M. Baumgartner et al., nnDetection: A self-configuring method for medical object detection, MICCAI 2021.
BibTeX
@article{djahnine2024pulmonaryembolism,
  title = {Detection and severity quantification of pulmonary embolism with 3D CT data using an automated deep learning-based artificial solution},
  author = {A. Djahnine and C. Lazarus and M. Lederlin and S. Mulé and R. Wiemker and S. Si-Mohamed and E. Jupin-Delevaux and O. Nempont and Y. Skandarani and M. De Craene and S. Goubalan and C. Raynaud and Y. Belkouchi and A. Ben Afia and C. Fabre and G. Ferretti and C. De Margerie and P. Berge and R. Liberge and N. Elbaz and M. Blain and P. Brillet and G. Chassagnon and F. Cadour and C. Caramella and M. El Hajjam and S. Boussouar and J. Hadchiti and X. Fablet and A. Khalil and H. Talbot and A. Luciani and N. Lassau and L. Boussel},
  journal = {Diagnostic and Interventional Imaging (DII)},
  year = {2024},
  doi = {10.1016/j.diii.2023.09.006}
}