eCAPRI: a novel tool combining clinical and imaging data for post-TAVI mortality prediction
1 Hospices Civils de Lyon · 2 Philips Research France, Suresnes · 3 CREATIS UMR5220, INSERM U1044, INSA, Université de Lyon
Abstract
Objectives: Transcatheter aortic valve implantation (TAVI) is crucial for treating calcified aortic stenosis (CAS), yet post-procedural outcomes remain variable. The CAPRI score previously showed promising results in predicting 1-year all-cause mortality, by combining manually measured thoracic aortic calcium (TAC) volume with clinical risk factors. This study introduces an enhanced CAPRI score (eCAPRI), which automates TAC volume measurement and incorporates additional automatically extracted biomarkers from pre-operative CT scans.
Materials and methods: TAC volume extraction was automated using a deep learning model trained on 66 patients and evaluated on 1111 CT scans. Additional automatically extracted imaging biomarkers were incorporated into the eCAPRI score, following the original methodology for biomarker selection. The eCAPRI score was trained on 765 pre-TAVI CT scans for one-year mortality prediction and then compared to CAPRI and EuroSCORE Logistic using AUC, bootstrap tests, and calibration curves on 192 CT scans.
Results: Automated TAC segmentation achieved a mean Dice score of 0.777 ± 0.108. The eCAPRI score included body surface area (BSA)-indexed right ventricle volume, BSA-indexed pulmonary arteries max diameter, and abdominal muscles surface at L3 level in addition to automatically computed TAC volume and clinical biomarkers previously identified in the CAPRI score. On the evaluation dataset, eCAPRI showed an AUC of 0.731, outperforming CAPRI (AUC = 0.669) and EuroSCORE Logistic (AUC = 0.588) significantly (p = 0.034), with better calibration.
Conclusion: The eCAPRI score, combining fully automated TAC volume extraction and additional imaging biomarkers, improved one-year mortality prediction over CAPRI and EuroSCORE Logistic. It may support standardized risk stratification in TAVI patients.
Keywords: TAVI; Risk assessment; Imaging biomarkers; Automated extraction; Aortic stenosis
Introduction
TAVI has become a validated alternative to surgical valve replacement for severe aortic stenosis, yet up to a quarter of high-risk patients still have poor outcomes at one year, largely because of comorbidities. The CAPRI score of Lantelme et al. predicts one-year mortality after TAVI by adding thoracic aortic calcium (TAC) volume measured on CT to clinical, biological and demographic factors (AUC 0.68). Its main barrier to adoption is the manual annotation of calcium, which is slow.
Imaging biomarkers measured automatically on routine CT have also shown value for long-term outcome prediction. eCAPRI automates TAC measurement with deep learning and adds further CT biomarkers to improve the CAPRI score.
Method
2.1The CAPRI score
Variables are selected with univariate Cox regressions and a likelihood ratio test, then checked for mutual correlation. The score of a patient sums, over the selected variables, the Cox coefficient βi times the deviation of the variable from its training-set mean.
Table 1: CAPRI score variables (paper Table 1). PAPs, pulmonary artery pressure; TIA, transient ischemic attack; NYHA, New York Heart Association; TAC, thoracic aortic calcium.
| Variable | Type | Definition |
|---|---|---|
| Male | Discrete | Patient sex |
| PAPs available | Discrete | Whether pulmonary artery pressure was measured |
| Peripheral arterial disease | Discrete | Diagnosis (yes/no) |
| Respiratory failure | Discrete | Diagnosis (yes/no) |
| TIA, stroke | Discrete | Diagnosis (yes/no) |
| Coronary disease | Discrete | Diagnosis (yes/no) |
| NYHA | Discrete | Heart failure class, I to IV |
| Mitral regurgitation | Discrete | Grade I to V |
| Clearance | Continuous | Kidney function grade, I (normal) to V (terminal failure) |
| Age (years) | Continuous | Age at admission |
| PAPs (×10 mmHg) | Continuous | Pulmonary artery pressure / 10, zero if unavailable |
| Aortic gradient (mmHg) | Continuous | LV pressure gradient |
| Ejection fraction (%) | Continuous | LV ejection fraction |
| TAC volume (mL) | Continuous | Thoracic aortic calcium above L1, here from the automated segmentation |
2.2Automated aortic calcium segmentation
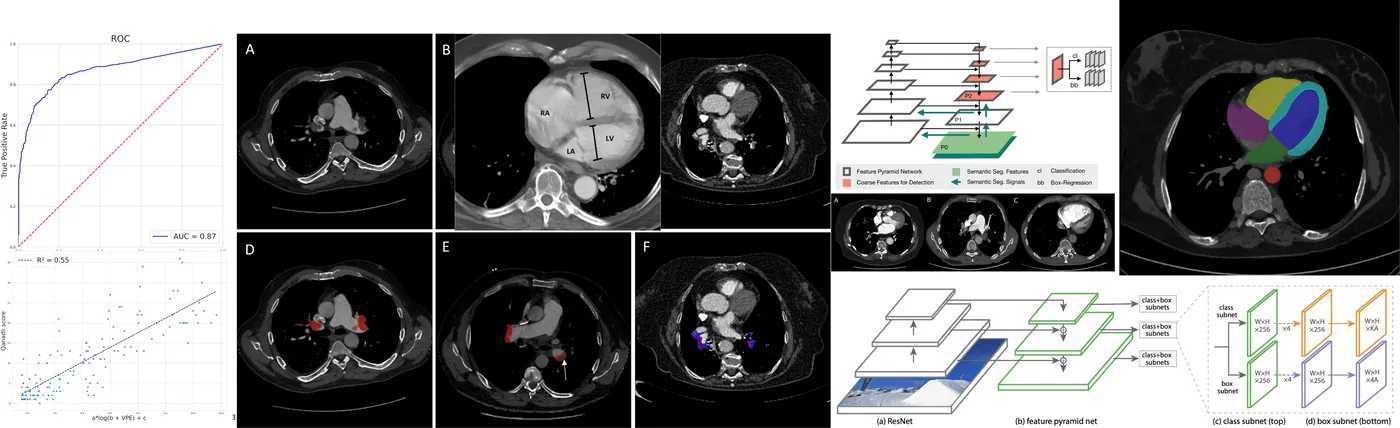
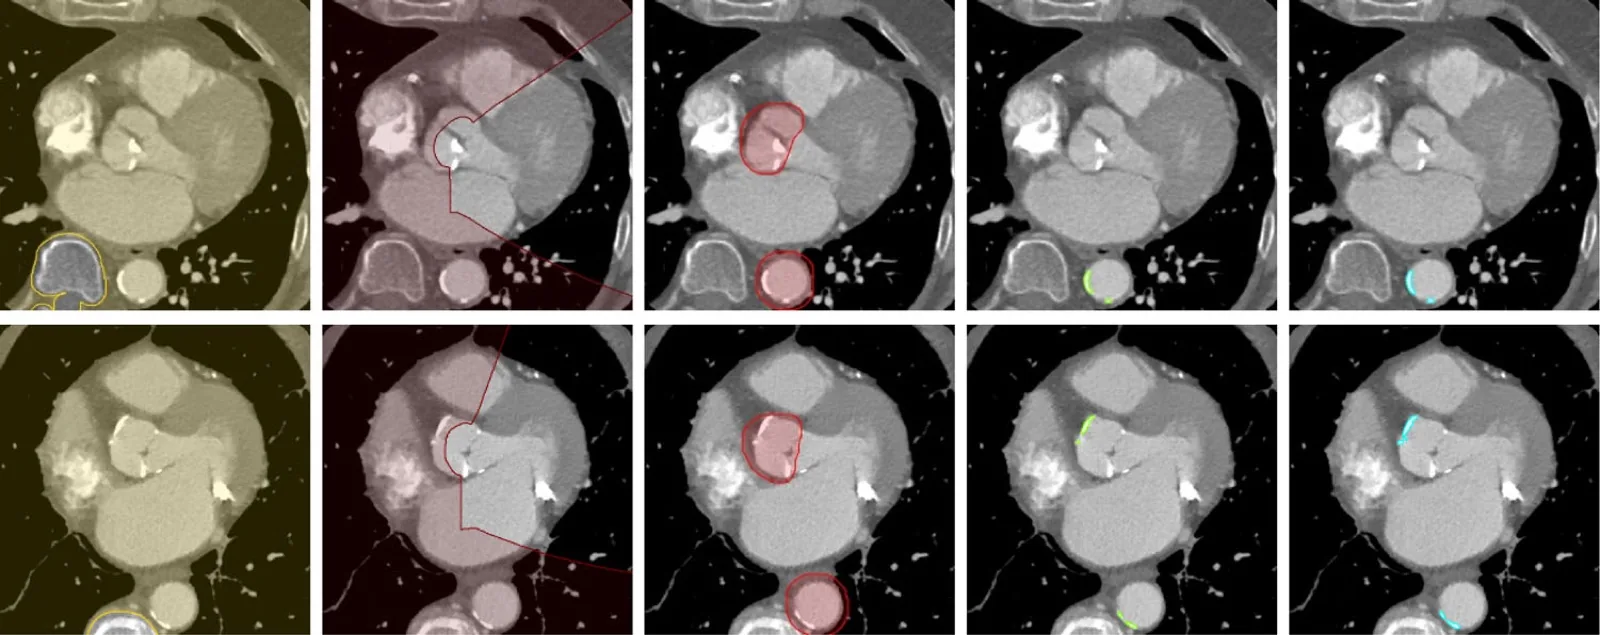
A 3D U-Net (TensorFlow 2.10) is trained with a masked binary cross-entropy: heart, great-vessel and spine segmentations provide exclusion masks for the spine and the aortic and mitral valves and a dilated aorta mask, so the network only learns what calcium looks like, not where it is. This allows a small network at full image resolution. Images are cropped around the aorta, windowed to [−200, 1000] HU and normalized to [−1, 1]; training uses batches of 5 random 100³ patches, Adam with a learning rate starting at 10⁻³ and decayed by 0.88 per epoch.
2.3Imaging biomarkers
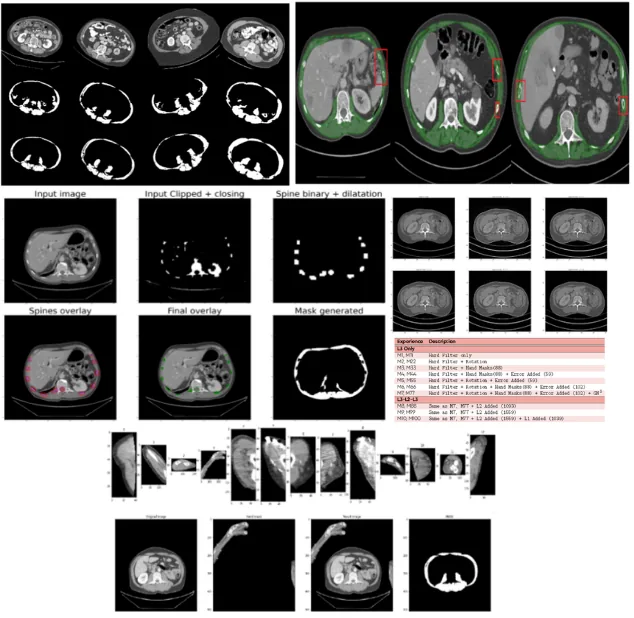
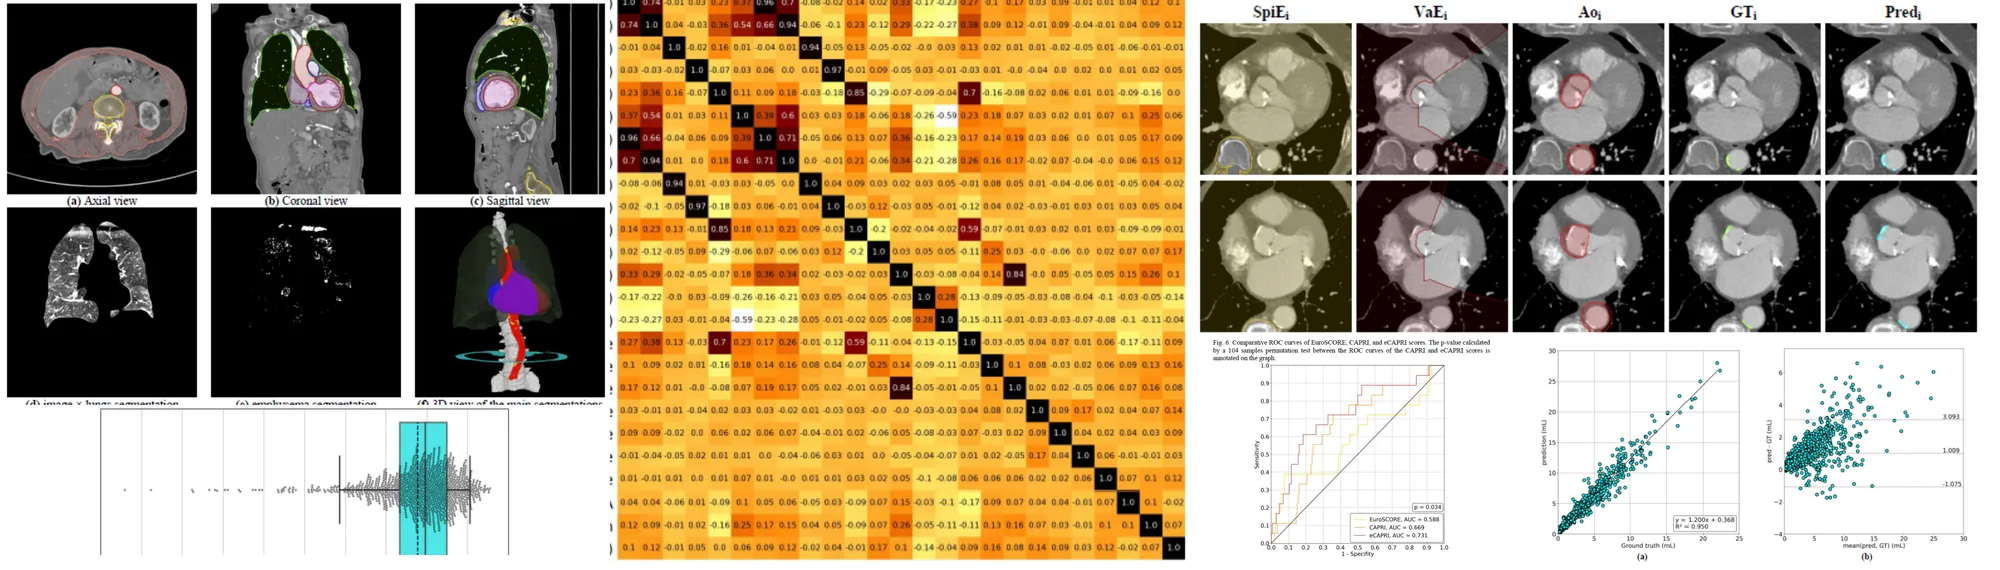
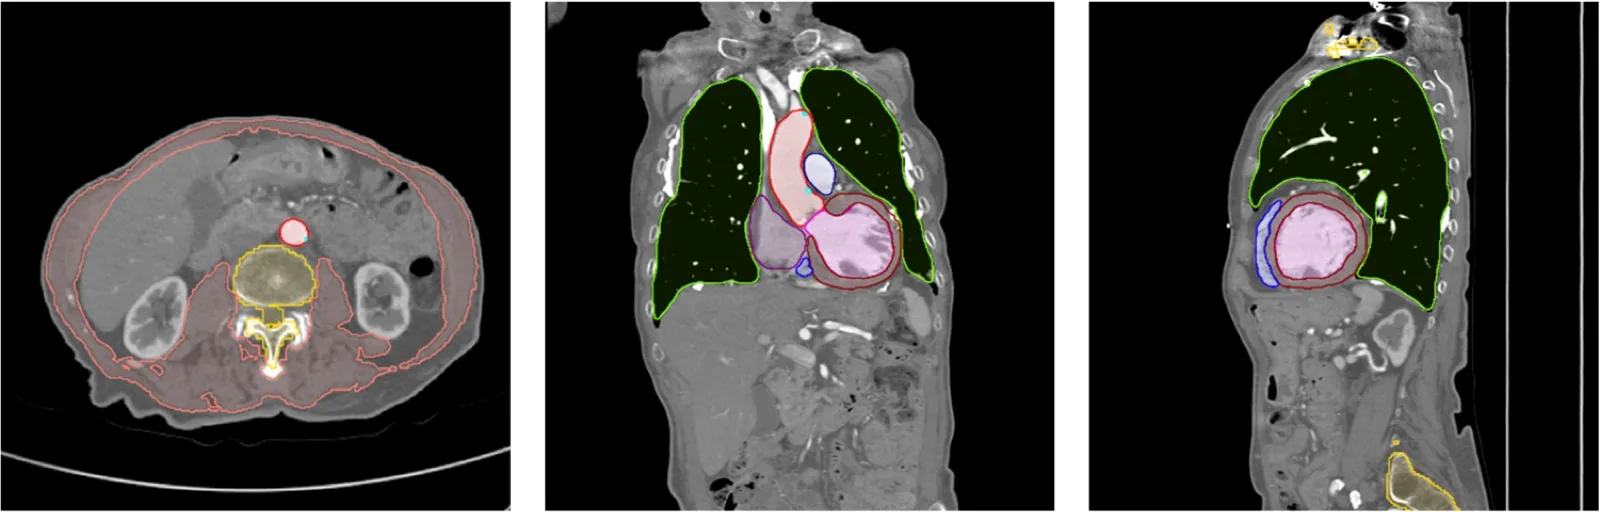
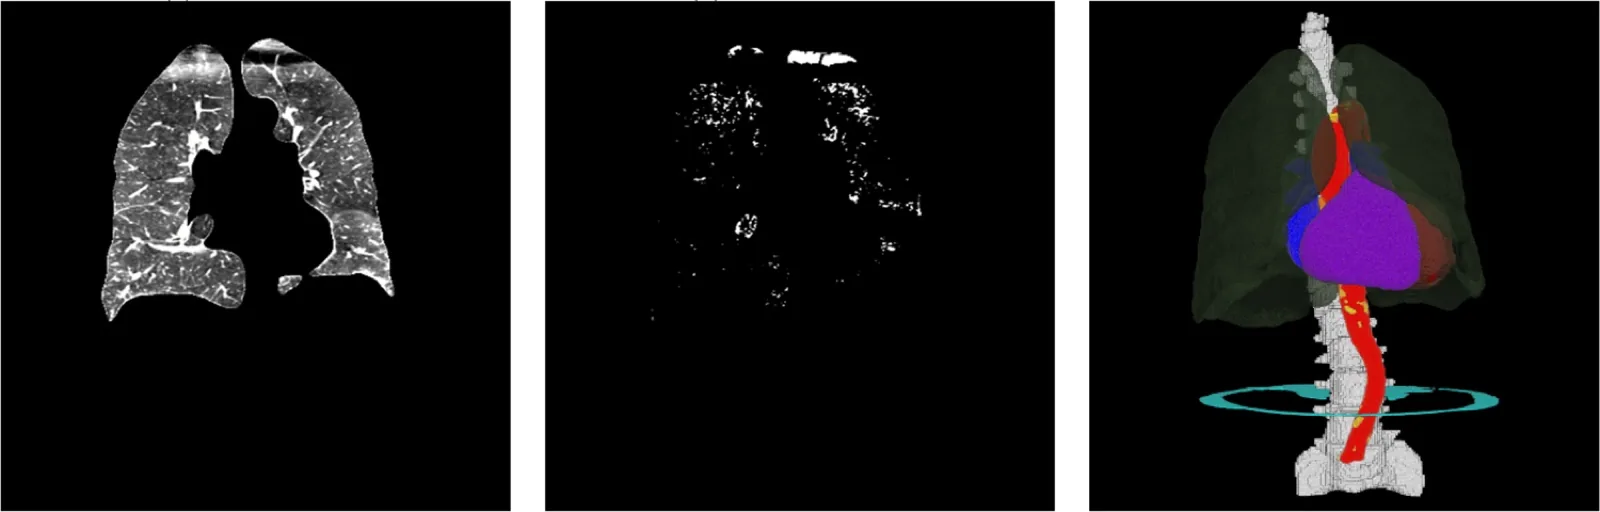
Pre-trained, locked models segment the heart chambers, great vessels, lungs, spine and abdominal muscles at L3. From them are derived the cardiac chamber and myocardium volumes, the maximal aorta and pulmonary-artery diameters (topological thinning), emphysema and healthy lung volumes and their ratio (voxels below −950 HU), and the abdominal muscle surface at L3, a marker of sarcopenia. Every biomarker except the emphysema ratio is also indexed to body surface area (BSAi). Fat and density measures were excluded because contrast agent biases them.
2.4Biomarker selection and eCAPRI
- Univariate filter. Keep biomarkers whose likelihood-ratio p-value is below 0.2, a loose threshold that allows for confounding interactions.
- Redundancy. Drop a biomarker correlated above 0.85 with a CAPRI variable or with a biomarker that has a better p-value.
- Combination search. Evaluate every combination of the remaining biomarkers added to the CAPRI variables with 4-fold cross-validation; the best mean AUC defines eCAPRI, which is then refit on the whole training set.
eCAPRI is compared with CAPRI (reweighted on the training set) and the EuroSCORE Logistic with ROC curves, a 10⁴-sample permutation test between CAPRI and eCAPRI, and calibration curves with Brier scores.
Experiments
3.1Data
Table 2: Datasets. The three datasets share no patients.
| Dataset | Patients | Content | Use |
|---|---|---|---|
| CalciumTrain | 66 | Chest-abdomen-pelvis CT: 43 unenhanced, 23 arterial phase; semi-automatic calcium annotations | Train the calcium segmentation network |
| CalciumEval | 1,111 | Pre-TAVI contrast CT; calcium annotated slice by slice by senior radiologists | Evaluate calcium segmentation |
| TAVI-Lyon | 957 | TAVI 2013–2021, 4 hospitals, GE / Siemens / Philips scanners; 1-year follow-up, 81 deaths (9.3%) | Develop (765) and evaluate (192) eCAPRI |
The TAVI-Lyon cohort (479 men, 478 women, mean age 82.35 ± 7.53) was split 80/20 with an equal proportion of deaths. Comorbidities were frequent: renal impairment of stage III or worse in over half of patients, NYHA class III/IV heart failure in 49% and atrial fibrillation in 31%.
3.2Calcium segmentation
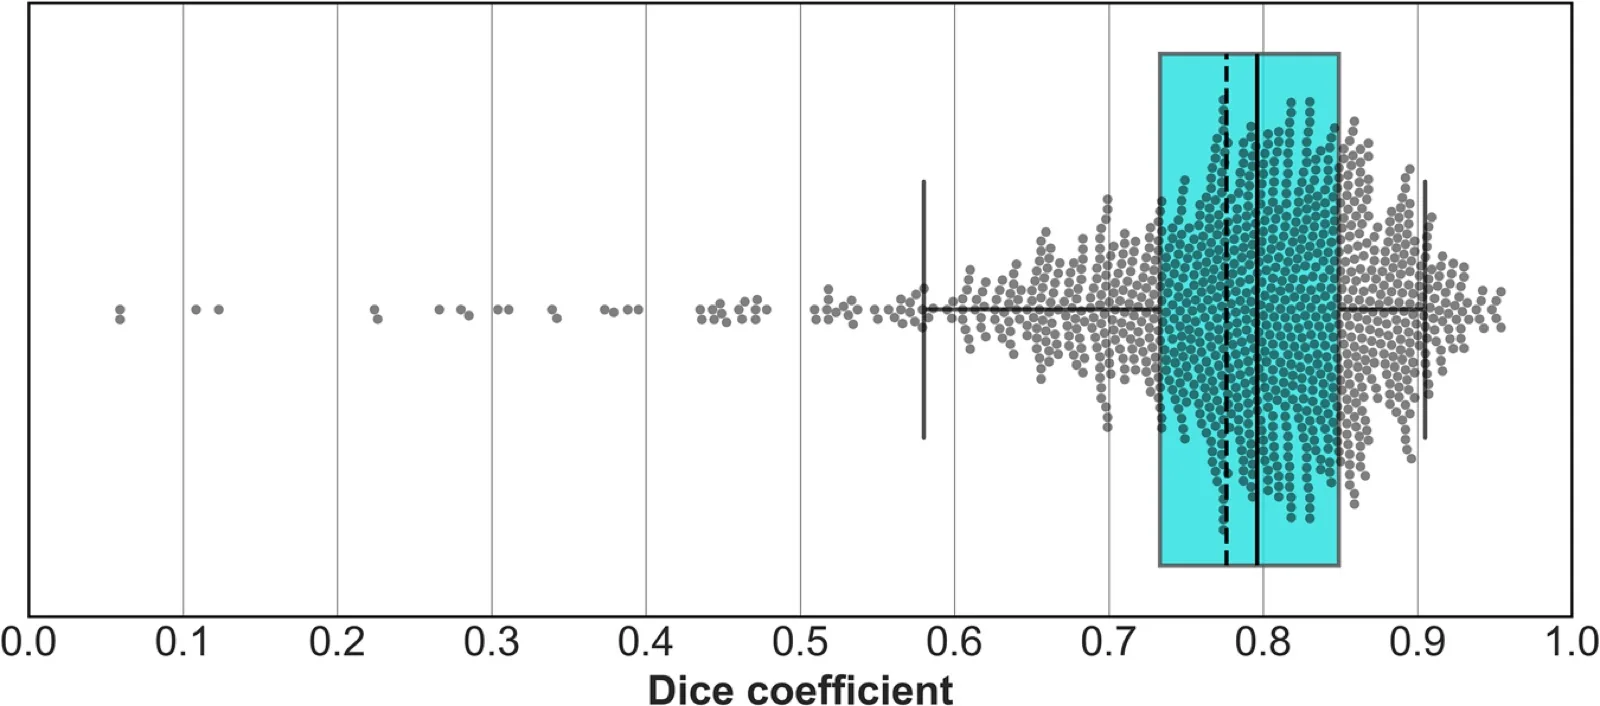
Table 3: Automated TAC segmentation on CalciumEval (1,111 scans): distribution of Dice coefficients.
| Statistic | Dice |
|---|---|
| Mean ± SD | 0.777 ± 0.108 |
| Median | 0.796 |
| First / third quartile | 0.733 / 0.849 |
| 5th / 95th percentile | 0.584 / 0.905 |
| Range | 0.059 – 0.954 |
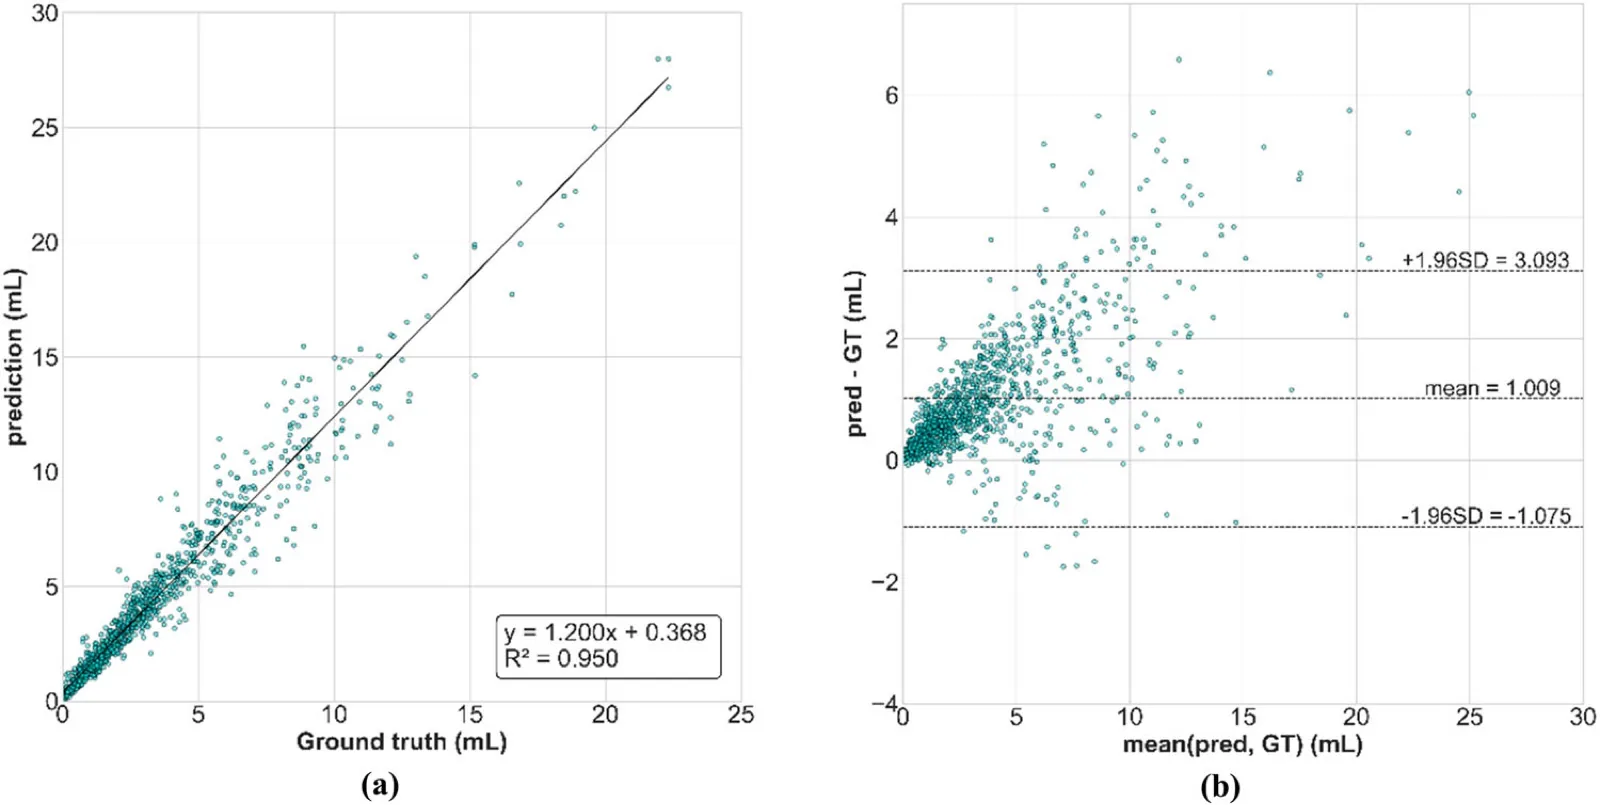
Key findings
- Accurate on a large cohort: a mean Dice of 0.777 on 1,111 contrast scans, from only 66 training patients.
- Low Dice comes from tiny volumes: 60 scans fall below 0.6; the 29 below 0.5 have a mean calcium volume of 0.4 mL, versus 4.2 mL overall.
- Slight overestimation: predicted volumes run a little above the ground truth; heavily injected vena cava, artefacts and tracheal calcifications cause most errors.
3.3Biomarker selection
Table 4: Univariate Cox regressions of the candidate biomarkers for 1-year all-cause mortality (paper Table 3). † passed the univariate selection (p < 0.2); highlighted rows are the three biomarkers retained in eCAPRI. BSAi, body-surface-area-indexed; LA/LV/RA/RV, left/right atrium/ventricle; Myo, myocardium; Ao, aorta; PA, pulmonary arteries.
| Biomarker | β | HR | AUC | p-value |
|---|---|---|---|---|
| Lungs volume (mL) | 0.000 | 1.000 | 0.464 | 0.214 |
| Emphysema volume (mL) | -0.004 | 0.996 | 0.475 | 0.384 |
| LA volume (mL) | 0.001 | 1.001 | 0.533 | 0.535 |
| LV volume (mL) | 0.002 | 1.002 | 0.541 | 0.374 |
| Myo volume (mL) | 0.000 | 1.000 | 0.504 | 0.906 |
| RA volume (mL) † | 0.002 | 1.002 | 0.569 | 0.165 |
| RV volume (mL) † | 0.004 | 1.004 | 0.588 | 0.043 |
| Ao max radius (cm) † | -0.141 | 0.868 | 0.441 | 0.068 |
| PA max radius (cm) † | 0.167 | 1.182 | 0.532 | 0.132 |
| L3 level muscles surface (cm²) † | -0.010 | 0.990 | 0.434 | 0.024 |
| BSAi lungs volume (mL/m²) | 0.000 | 1.000 | 0.487 | 0.572 |
| BSAi emphysema volume (mL/m²) | -0.005 | 0.995 | 0.478 | 0.495 |
| BSAi LA volume (mL/m²) | 0.004 | 1.004 | 0.558 | 0.296 |
| BSAi LV volume (mL/m²) † | 0.006 | 1.006 | 0.560 | 0.155 |
| BSAi Myo volume (mL/m²) | 0.004 | 1.004 | 0.527 | 0.386 |
| BSAi RA volume (mL/m²) † | 0.006 | 1.006 | 0.584 | 0.060 |
| BSAi RV volume (mL/m²) † | 0.010 | 1.010 | 0.608 | 0.005 |
| BSAi Ao max radius (cm/m²) † | -0.193 | 0.824 | 0.454 | 0.167 |
| BSAi PA max radius (cm/m²) † | 0.356 | 1.427 | 0.538 | 0.048 |
| BSAi L3 level muscles surface (cm²/m²) † | -0.019 | 0.981 | 0.461 | 0.064 |
| Emphysema ratio (%) | -0.082 | 0.921 | 0.481 | 0.413 |
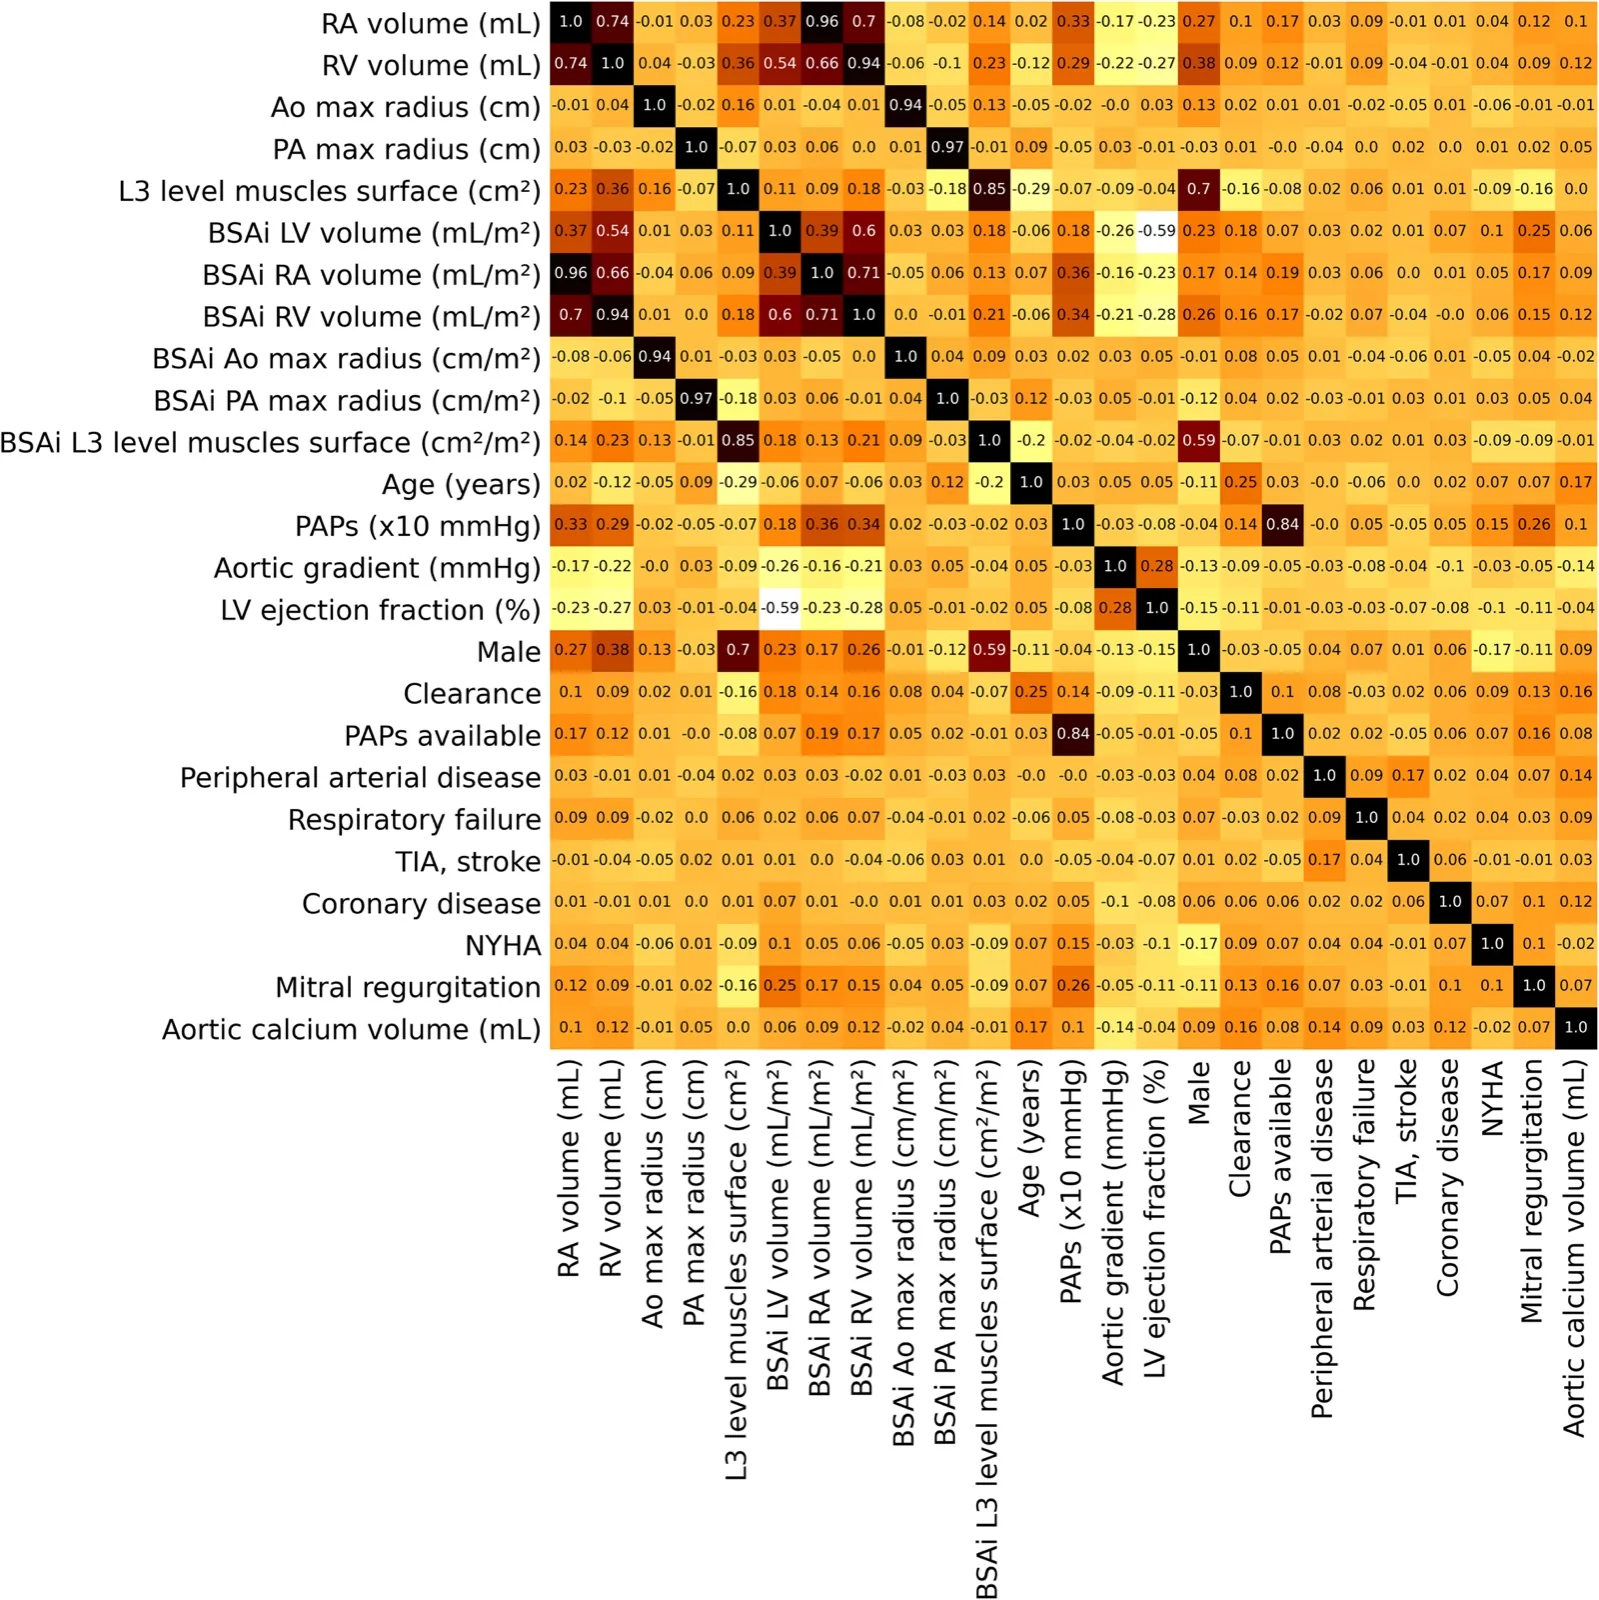
Key findings
- Lungs carry little signal: pulmonary biomarkers were largely uncorrelated with one-year death.
- Three biomarkers retained: BSA-indexed right-ventricle volume, BSA-indexed pulmonary-artery maximal diameter and L3 muscle surface — clinically recognized markers of right heart dysfunction, pulmonary hypertension and frailty.
3.4Mortality prediction
Table 5: One-year all-cause mortality prediction on the evaluation set (192 patients). Lower Brier score is better.
| Score | AUC | Brier score |
|---|---|---|
| EuroSCORE Logistic | 0.588 | 0.090 |
| CAPRI (reweighted on our training set) | 0.669 | 0.082 |
| eCAPRI | 0.731 | 0.079 |
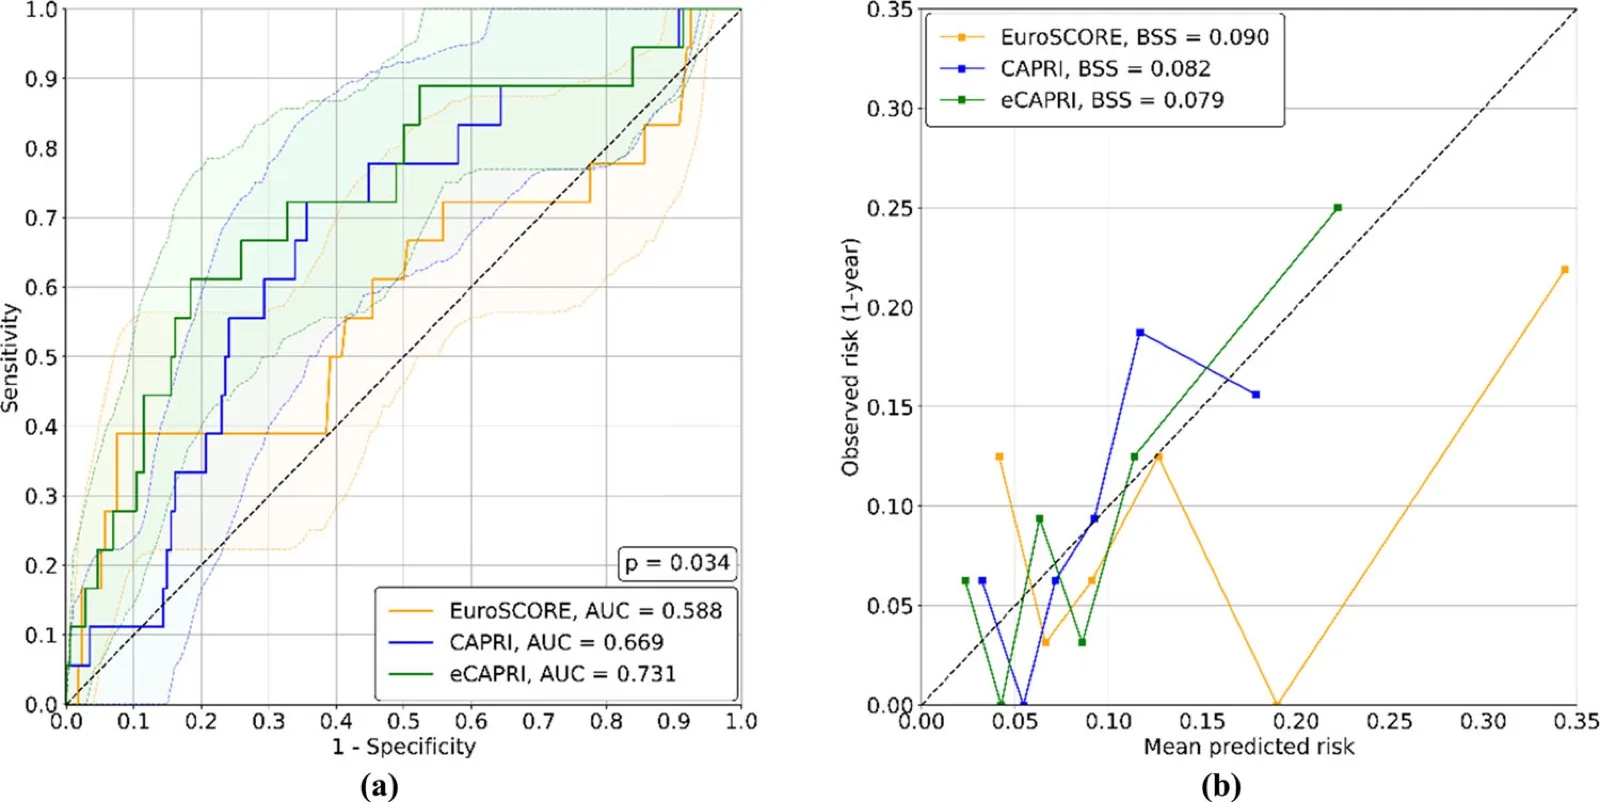
Table 6: Final Cox coefficients β of CAPRI and eCAPRI fitted on the whole training set, and training-set mean X̄ of each variable (paper Table 4).
| Variable | CAPRI β | eCAPRI β | X̄ |
|---|---|---|---|
| Age (years) | 0.0115 | −0.0017 | 82.19 |
| PAPs (×10 mmHg) | 0.1620 | 0.1496 | 3.10 |
| Aortic gradient (mmHg) | −0.0032 | −0.0033 | 48.62 |
| LV ejection fraction (%) | 0.0027 | 0.0088 | 56.70 |
| Male | 0.1806 | 0.9495 | 0.51 |
| Clearance | 0.4433 | 0.3635 | 1.67 |
| PAPs available | −0.3357 | −0.3648 | 0.74 |
| Peripheral arterial disease | 0.0262 | 0.1262 | 0.12 |
| Respiratory failure | 0.1801 | 0.1569 | 0.20 |
| TIA, stroke | 0.3529 | 0.4121 | 0.11 |
| Coronary disease | −0.4413 | −0.4802 | 0.32 |
| NYHA | 0.1998 | 0.2177 | 1.41 |
| Mitral regurgitation | 0.0382 | −0.0584 | 0.83 |
| Aortic calcium volume (mL) | −0.0394 | −0.0432 | 3.79 |
| L3 level muscles surface (cm²) | – | −0.0221 | 120.32 |
| BSAi RV volume (mL/m²) | – | 0.0068 | 74.02 |
| BSAi PA max radius (cm/m²) | – | 0.3040 | 0.95 |
Key findings
- Better discrimination: eCAPRI reaches AUC 0.731, significantly above CAPRI (0.669) and the EuroSCORE Logistic (0.588).
- Better calibration: the lowest Brier score (0.079) and the calibration curve closest to ideal; the EuroSCORE underestimates risk in the highest deciles.
- Automation preserves CAPRI: with automated calcium, CAPRI reaches AUC 0.669, close to the original publication (0.68).
Discussion & limitations
Because every TAVI candidate already has a pre-procedural contrast CT, all eCAPRI inputs are available in routine care. With automated segmentation and biomarker extraction, it could run in the background on radiology workstations or PACS and give clinicians a standardized risk estimate without extra workload. The segmentation still struggles with hardening artefacts near the aorta and tracheal calcifications, and slightly overestimates calcium volume. The −950 HU emphysema threshold may not suit contrast scans, which could explain why emphysema was not retained. Further validation on broader populations remains important.
Related links
- eCAPRI: a novel tool combining clinical and imaging data for post-TAVI mortality prediction, European Radiology 36:3542–3555 (2026). Open access under a CC BY 4.0 licence; the figures on this page are reproduced from the article, and the tables are adapted from it.
- P. Lantelme et al., the original CAPRI score for one-year mortality after TAVI.
BibTeX
@article{djahnine2025ecapri,
  title = {eCAPRI: a novel tool combining clinical and imaging data for post-TAVI mortality prediction},
  author = {PJ. Lartaud and B. Harbaoui and A. Della Corte and A. Djahnine and O. Nempont and JM. Rouet and A. Cecilia Vlachomitrou and B. Riche and M. Rabilloud and S. Si-Mohamed and P. Douek and F. Derimay and G. Rioufol and P. Lantelme and L. Boussel},
  journal = {European Radiology},
  year = {2026},
  doi = {10.1007/s00330-025-12184-x}
}