CT-3DFlow: Leveraging 3D Normalizing Flows for Unsupervised Detection of Pathological Pulmonary CT Scans
1 Claude Bernard University Lyon 1 · 2 Philips Health Technology Innovation, Paris · 3 Department of Radiology, Hospices Civils de Lyon · 4 National Reference Center for Rare Pulmonary Diseases, Louis Pradel Hospital, Lyon
Abstract
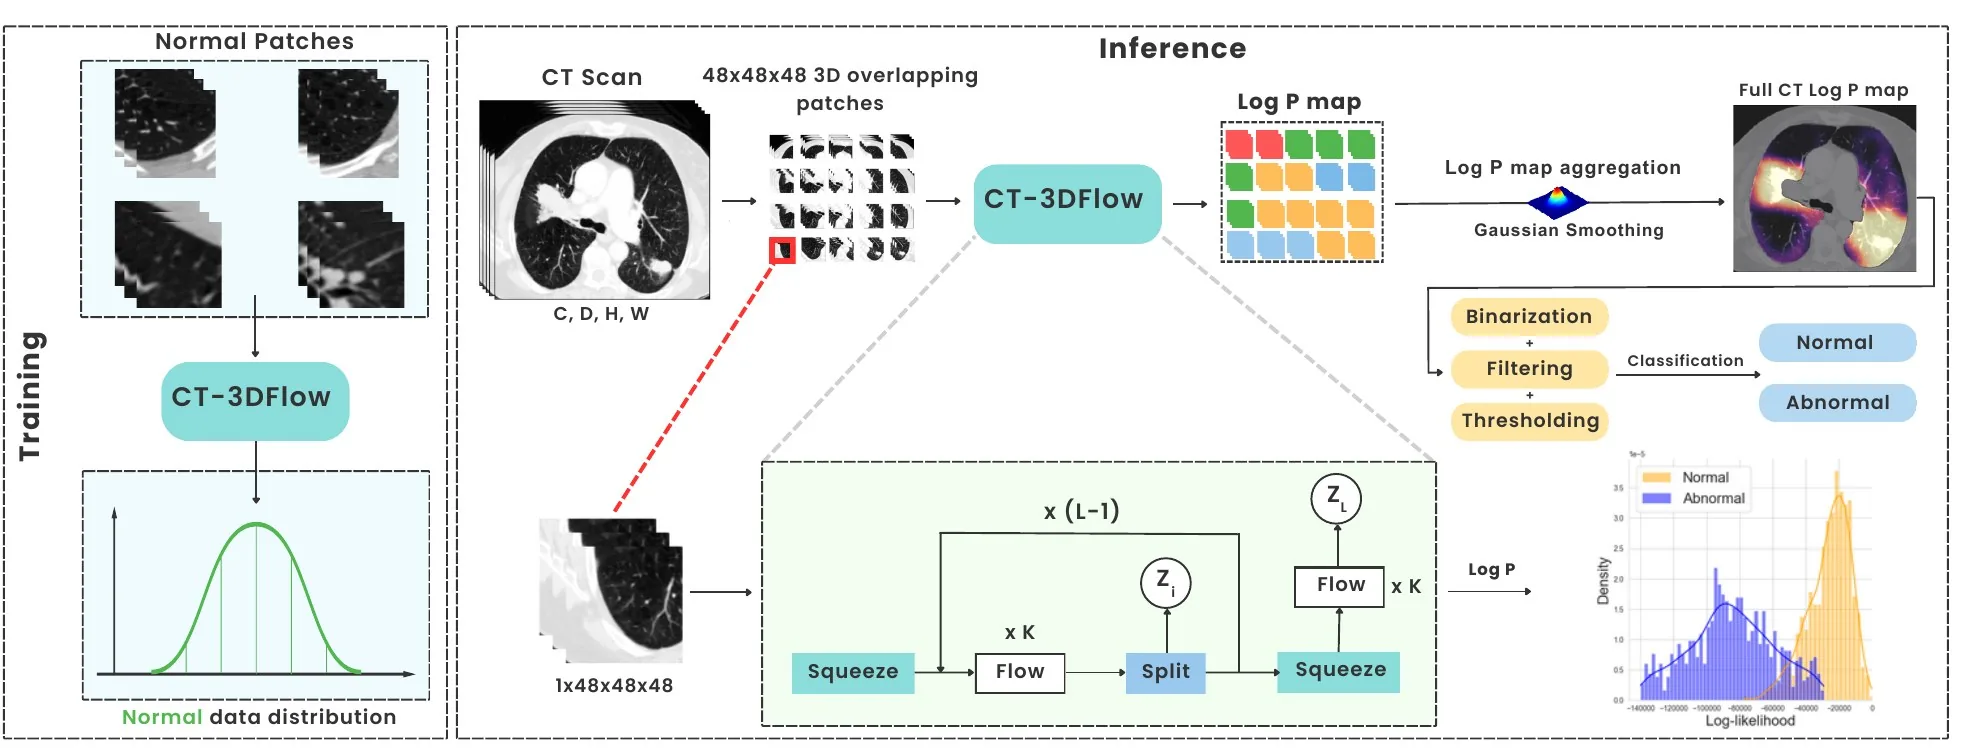
Unsupervised pathology detection can be implemented by training a model on healthy data only and measuring the deviation from the training set upon inference, for example with CNN-based feature extraction and one-class classifiers, or reconstruction-score-based methods such as AEs, GANs and Diffusion models. Normalizing Flows (NF) have the ability to directly learn the probability distribution of training examples through an invertible architecture. We leverage this property in a novel 3D NF-based model named CT-3DFlow, specifically tailored for patient-level pulmonary pathology detection in chest CT data. Our model is trained unsupervised on healthy 3D pulmonary CT patches, and detects deviations from its log-likelihood distribution as anomalies. We aggregate patches-level likelihood values from a patient's CT scan to provide a patient-level 'normal'/'abnormal' prediction. Out-of-distribution detection performance is evaluated using expert annotations on a separate chest CT test dataset, outperforming other state-of-the-art methods.
Keywords: Unsupervised Anomaly Detection · Normalizing Flow · GLOW · Pulmonary CT
Introduction
Normalizing flows such as NICE, RealNVP and GLOW learn a data distribution by mapping it to a tractable one through invertible, differentiable transformations, which gives exact log-likelihoods at inference. Flow-based anomaly detectors — DifferNet, CFLOW-AD and FastFlow — perform well on industrial images, but they work on 2D images or CNN features and ignore the 3D context of volumetric data.
Applying flows directly to 3D scans is hard: a model trained on whole volumes would need far more memory than 2D approaches. The few 3D anomaly detectors, such as PET-3DFlow, work at feature level and score anomalies with a mix of likelihood and reconstruction error. CT-3DFlow instead applies a 3D extension of GLOW to patches, keeping volumetric context while staying tractable.
Method
2.1Patch-based 3D normalizing flow
The model is a GLOW architecture adapted to 3D, with L = 4 blocks of K = 64 flow steps. Each step chains an activation normalization, an invertible 1×1×1 convolution and an affine coupling layer; squeeze and split operations between blocks factor out latent variables zi. Trained by maximum likelihood on healthy patches only, the flow learns the distribution of normal lung tissue.
2.2From patch likelihoods to a patient prediction
- Score patches. The model is applied to 48³ patches covering the whole volume, with a 10-voxel overlap; each patch receives a log-likelihood (Log P) that serves as an anomaly score.
- Aggregate. Patch Log P values are combined with Gaussian smoothing into a full-CT Log P map.
- Post-process. The map is binarized and filtered.
- Decide. A threshold T on the abnormal volume, between 0.5 and 20 cm³, is chosen on the validation ROC curve and gives the normal/abnormal prediction.
2.3Implementation
Table 1: Implementation details.
| Setting | Value |
|---|---|
| Architecture | GLOW adapted to 3D: L = 4 blocks, K = 64 flows per block |
| Flow step | Activation normalization, invertible 1×1×1 convolution, affine coupling |
| Input | 1 × 48 × 48 × 48 patches, 2 mm resolution |
| Intensities | Clipped to [−1020, +200] HU, normalized to [−0.5, +0.5] |
| Objective | Maximum likelihood |
| Optimizer | Adam, learning rate 10⁻⁴, weight decay 10⁻⁵ |
| Batch size / iterations | 10 / 50,000 |
| Hardware | 2 × NVIDIA A100 SXM4 |
| Inference | 48³ patches with 10-voxel overlap; threshold T ∈ [0.5, 20] cm³ |
Experiments
3.1Data
Table 2: Dataset: 822 patients with 3D chest CT from a single institution (Hospices Civils de Lyon), 570 normal and 252 abnormal scans.
| Split | Scans | Composition | Use |
|---|---|---|---|
| Training | 470 | Normal scans | 500,000 normal 48³ patches |
| Validation | 111 | 50 normal · 61 abnormal | Threshold T selection (ROC curve) |
| Test | 291 | Normal and abnormal, expert-annotated | Patient-level evaluation |
Scans are resampled to 2 mm, the lungs are segmented automatically in 3D to guide patch selection, voxel values are clipped to [−1020, +200] HU and normalized to [−0.5, +0.5]. The abnormal scans contain four distinct chest abnormalities, selected by an expert radiologist based on the prevalence of the most common pulmonary pathologies.
3.2Baselines and metrics
CT-3DFlow is compared on the test set with reconstruction-based models (autoencoder, variational autoencoder), GAN-based models (f-AnoGAN, GANomaly), normalizing-flow models (DifferNet, FastFlow, CFLOW-AD) and a diffusion model (AnoDDPM). Patient-level classification is measured with AUROC, F1 score and accuracy.
3.3Results
Table 3: Comparison of patient-level classification performance with several anomaly detection methods (paper Table 1). Best in bold, second best underlined.
| Method | Family | AUROC | F1 | Accuracy |
|---|---|---|---|---|
| AE | Reconstruction | 0.608 | 0.538 | 0.556 |
| VAE | Reconstruction | 0.647 | 0.607 | 0.598 |
| f-AnoGAN | GAN | 0.821 | 0.783 | 0.765 |
| GANomaly | GAN | 0.772 | 0.74 | 0.694 |
| DifferNet | Normalizing flow (2D) | 0.901 | 0.861 | 0.843 |
| FastFlow | Normalizing flow (2D) | 0.942 | 0.912 | 0.903 |
| CFLOW-AD | Normalizing flow (2D) | 0.732 | 0.739 | 0.706 |
| AnoDDPM | Diffusion | 0.924 | 0.891 | 0.873 |
| CT-3DFlow (ours) | Normalizing flow (3D) | 0.952 | 0.94 | 0.924 |
Key findings
- Best on every metric: CT-3DFlow reaches AUROC 0.952, F1 0.94 and accuracy 0.924, ahead of the strongest baseline, FastFlow (0.942, 0.912, 0.903).
- 3D beats 2D flows: the 3D patch-based flow outperforms the 2D flow models while avoiding the memory cost of full-volume flows.
- Reconstruction is weakest: autoencoder-based methods stay below 0.65 AUROC, consistent with reconstruction being a sub-optimal anomaly score.
Conclusion & perspectives
CT-3DFlow outperforms state-of-the-art anomaly detection methods by a noticeable margin in AUROC, F1 and accuracy, showing the benefit of a 3D flow-based model over 2D methods while mitigating the problems of full-volume normalizing flows. The aggregation methods need further validation given the inherent differences between 2D and 3D approaches, and extending the approach to other modalities and organs is planned.
Related links
- CT-3DFlow: Leveraging 3D Normalizing Flows for Unsupervised Detection of Pathological Pulmonary CT scans, arXiv:2403.18514, 2024.
- Automatic Detection of Pathologies in Conventional Scanner Data, PhD thesis, INSA Lyon, 2024.
- D. P. Kingma and P. Dhariwal, Glow: Generative Flow with Invertible 1×1 Convolutions, NeurIPS 2018.
- M. Rudolph et al., Same Same but DifferNet: Semi-supervised defect detection with normalizing flows, WACV 2021.
- J. Yu et al., FastFlow: Unsupervised anomaly detection and localization via 2D normalizing flows, 2021.
- D. Gudovskiy et al., CFLOW-AD: Real-time unsupervised anomaly detection with localization via conditional normalizing flows, WACV 2022.
BibTeX
@article{djahnine2024ct3dflow,
  title = {CT-3DFlow: Leveraging 3D Normalizing Flows for
           Unsupervised Detection of Pathological Pulmonary CT scans},
  author = {Djahnine, Aissam and Popoff, Alexandre and
            Jupin-Delevaux, Emilien and Cottin, Vincent and
            Nempont, Olivier and Boussel, Loic},
  journal = {arXiv preprint arXiv:2403.18514},
  year = {2024},
  doi = {10.48550/arXiv.2403.18514}
}